Figures & data
Table 1. Demographic characteristics of the respondents
Table 2. Primer sequences used for cell transfection
Table 3. Primer sequences in RT-qPCR
Table 4. Antibodies used in western blot analysis and immunohistochemistry
Figure 1. SNHG1 is highly expressed in patients with OPLL. A, PLL- or OPLL-derived LFCs identified by microscope observation and Vimentin immunofluorescence; B-C, mRNA (b) and protein (c) expression of osteogenesis-related factors BMP-2, RUNX2 and OCN determined by QRT-PCR and western blot analysis, respectively; D-E, the osteogenic properties of LFCs determined by Alizarin Red staining (d) and ALP (e) staining; F, the heatmap for differentially expressed lncRNAs between 4 OPLL tissues and 4 healthy PLL tissues determined by Arraystar Human LncRNA microarray V2.0 (Agilent_033010 Probe Name version); G, SNHG1 expression in 68 pairs of OPLL tissues and 18 pairs of PLL tissues identified by QRT-PCR; H, SNHG1 expression in cells after SNHG1 siRNA and SNHG1 overexpressing vector transfection determined by QRT-PCR as well. Data are expressed as the mean ± SD; in panels B and C, data were analyzed using two-way ANOVA, while data in panel H were analyzed using one-way ANOVA, and Tukey’s multiple comparisons test was used for the pairwise comparisons after ANOVA analysis; *, p < 0.05
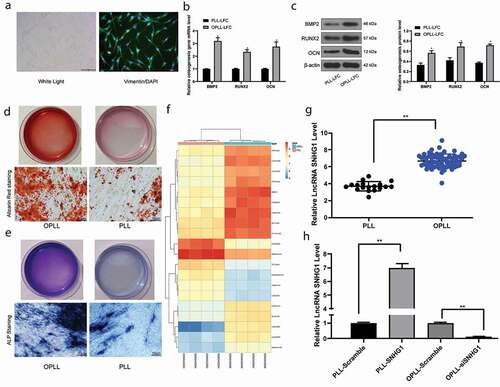
Figure 2. Silencing of SNHG1 inhibits the osteogenic differentiation of LFCs. A-B, mRNA (a) and protein (b) expression of osteogenesis-related factors BMP-2, RUNX2 and OCN determined by QRT-PCR and western blot analysis, respectively; C-D, the osteogenic properties of LFCs determined by alizarin red staining (c) and ALP (d) staining. The data are expressed as the mean ± SD. Two-way ANOVA and Tukey’s multiple comparison test was used to determine statistical significance; *, p < 0.05
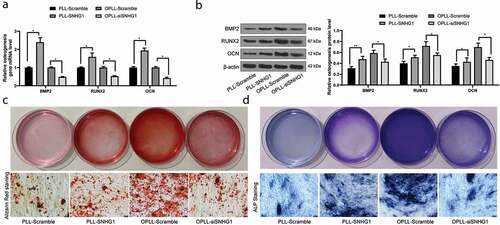
Figure 3. SNHG1 serves as a ceRNA for miR-320b to mediate IFNGR1 expression. A, subcellular localization of SNHG1 predicted on the lncATLAS DataBase (http://lncatlas.crg.eu/); B, FISH experiments with probes targeting SNHG1 were performed to validate the subcellular localization of SNHG1 in LFCs. The cytoplasm was stained with probes targeting SNHG1 (red stain), and the nuclei were stained with DAPI (blue stain); C, nuclear and cytoplasmic expression of SNHG1 in LFCs determined by QRT-PCR; D, heatmap for the top 30 differentially expressed genes between PLL- and OPLL- LFCs analyzed using the Llimma Rstudio based on GSE5464 microarray, with |LogFC ≥ 4.0| and p < 0.05 as the screening criteria; E, KEGG-based clustering analysis was performed on DAVID 6.8 software, and a total of 43 pathways where the differentially genes clustered were figured out; F, genes clustered on the JAK/STAT signal pathway; G, intersected miRNAs that could bind to SNHG1 and IFNGR1 predicted on StarBase; H, binding relationships between SNHG1 and miR-320b and between miR-320b and IFNGR1 validated by dual luciferase reporter gene assay. The data are expressed as the mean ± SD; two-way ANOVA and Tukey’s multiple comparison test was used to determine statistical significance; *, p < 0.05
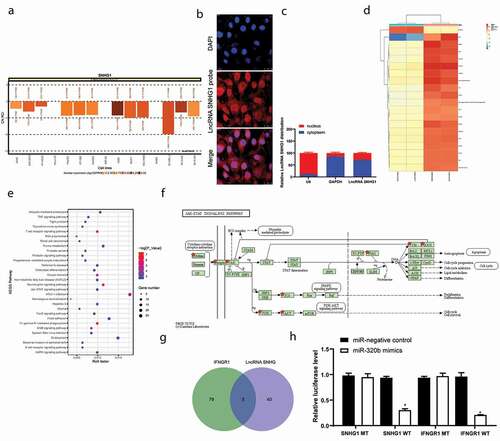
Figure 4. Overexpression of miR-320b inhibits the osteogenic differentiation of LFCs. miR-320b mimic or mock were transfected into PLL-derived LFCs with overexpressed SNHG1, and miR-320b inhibitor or inhibitor control were transfected into OPLL-derived LFCs with silenced SNHG1. A, miR-320b expression in cells after transfection measured by QRT-PCR; B-C, mRNA (b) and protein (c) expression of BMP-2, RUNX2 and OCN in cells determined by QRT-PCR and western blot analysis, respectively; D-E, osteogenic properties of LFCs detected by alizarin red staining (d) and ALP staining (e). The data are expressed as the mean ± SD; in panel A, data were analyzed using one-way ANOVA, while data in panels B and C were analyzed using two-way ANOVA, and Tukey’s multiple comparison test was used to determine statistical significance; *, p < 0.05
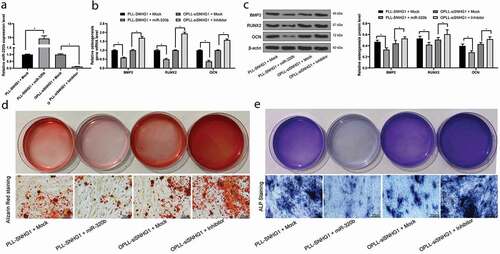
Figure 5. JAK-STAT signaling pathway activation promotes the osteogenic differentiation of LFCs. A, western blot analysis was performed to measure the phosphorylation of JAK2, STAT1 and STAT3 in LFCs; Then, OPLL-derived Fedratinib, a JAK2-specific agonist, was administrated into the LFCs; Next, B-C, the mRNA (b) and protein (c) expression of BMP2, RUNX2 and OCN was determined by QRT-PCR and western blot analysis, respectively; D-E, osteogenic properties of LFCs were detected by alizarin red staining (d) and ALP staining (e). The data are expressed as the mean ± SD; two-way ANOVA and Tukey’s multiple comparison test was used to determine statistical significance; *, p < 0.05
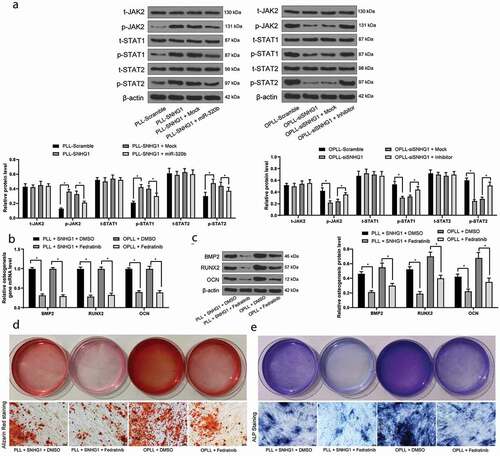
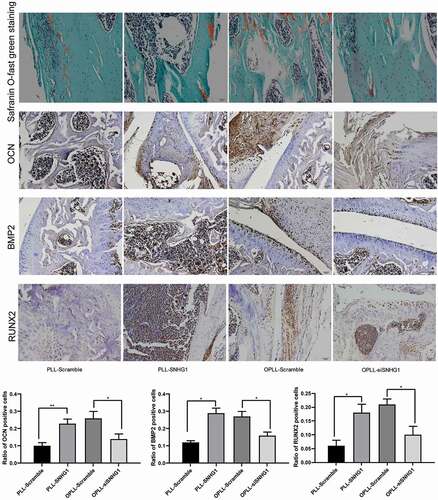
Figure 6. Silencing of SNHG1 inhibited the osteogenic differentiation of LFCs in vivo. HE staining was performed to observe the scaffold morphology and immunohistochemistry staining was performed to identify the expression of OCN, BMP2 and RUNX2 in the scaffolds seeded with different cell types. The data are expressed as the mean ± SD; one-way ANOVA and Tukey’s multiple comparison test was used to determine statistical significance; *, p < 0.05