
Figures & data
Figure 1. The flowchart of the present study
Figure 2. Meta-analysis of TRPS1 expression in gastric cancer. (a) Forest plot of studies calculating the standard mean difference (SMD) of TRPS1 expression based on the random effect model; (b) Sensitivity analysis; (c) Begg’s funnel plot
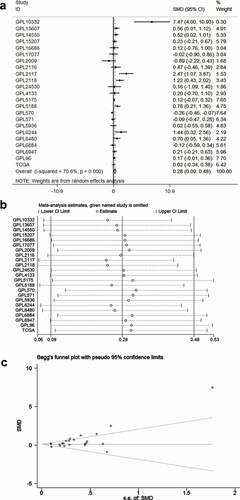
Figure 3. The diagnostic accuracy of TRPS1 in gastric cancer. The pooled sensitivity, specificity, positive LR, negative LR, diagnostic odds ratio, and the SROC of TRPS1 were 77.0% (75.0%-79.0%), 38.0% (35.0%-40.0%), 1.29 (1.10–1.52), 0.62 (0.42–0.91), 2.49 (1.34–4.61), and 0.6585 separately (a, b, c, d, e, f). SROC, summary receiver operator characteristic
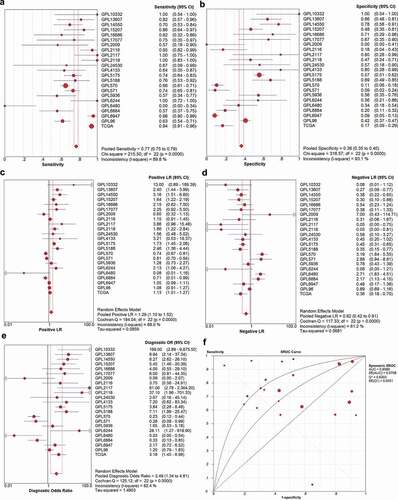
Figure 4. The meaningful ROC curve of TRPS1 expression to diagnose gastric cancer based on 23 datasets
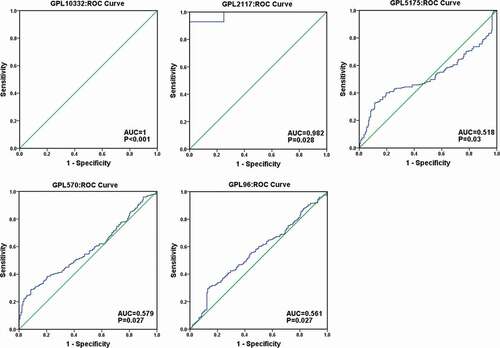
Table 1. The expression level of TRPS1 in different groups of clinical parameters
Table 2. Cox regression analysis of the effect of TRPS1 expression for overall survival in gastric cancer patients
Figure 5. The relative expression level of TRPS1 in gastric cancer tissues and its relationship with clinicopathological parameters in STAD patients based on public databases. (a) TRPS1 expression levels in STAD patients aged ≥60 y and aged < 60 y; (b) TRPS1 expression levels in STAD patients of non-intestinal type and intestinal type; (c) TRPS1 expression levels in grade 1–2 and grade 3 patients; (d) TRPS1 expression levels in T1–2 and T3–4 patients. STAD, stomach adenocarcinoma
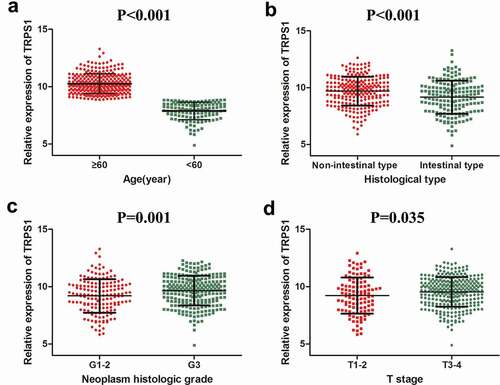
Figure 6. Analysis of the relationship between TRPS1 expression and survival of gastric cancer patients. (a) The relationship between TRPS1 expression and overall survival of gastric cancer patients illustrated in a Kaplan-Meier curve; (b) The relationship between TRPS1 expression and recurrence-free survival of gastric cancer patients illustrated in a Kaplan-Meier curve; (c) Cox multivariate regression analysis of the effect of TRPS1 expression level on the overall survival of gastric cancer patients; (d) Cox multivariate regression analysis of the effect of age on the overall survival of gastric cancer patients. HR, hazard ratio
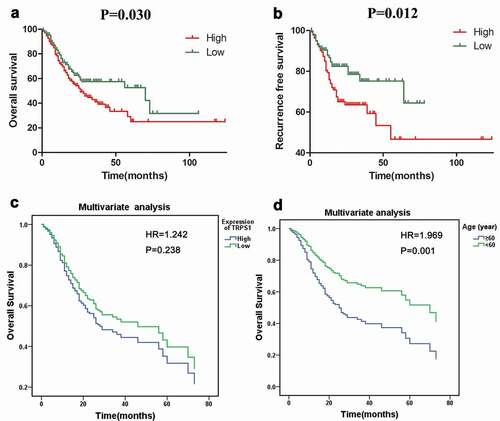
Table 3. Relationship between TRPS1 expression and clinicopathological features in gastric cancer
Figure 7. The expression level of TRPS1 protein in gastric cancer tissues and cells assessed by immunohistochemistry. (a, b) Expression of TRPS1 protein in gastric cancer tissue; (c, d) Expression of TRPS1 protein in normal gastric mucosa; (e) Expression of TRPS1 protein in HGC-27 gastric cancer cells; (f) Expression of TRPS1 protein in MGC-803 gastric cancer cells; (g) Expression of TRPS1 protein in normal GES-1 gastric mucosa cells. Magnification: 100X & 200X (a, b, c, d); 200X (e, f, g)
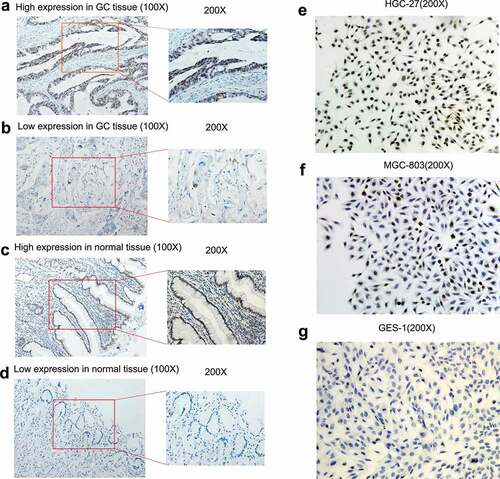
Figure 8. Construction of TRPS1 knockdown gastric cancer cells and cell function in vitro. (a) The distribution of MGC-803 gastric cancer cells transfected with empty plasmid; (b) The green fluorescence emitted by MGC-803 with empty plasmid according to cell distribution; (c) The distribution of MGC-803 gastric cancer cells transfected with TRPS1 knockdown plasmid; (d) The green fluorescence emitted by MGC-803 with TRPS1 knockdown plasmid according to cell distribution; (e) The relative expression of TRPS1 in MGC-803 gastric cancer cells transfected with empty plasmid and TRPS1 knockdown plasmid; (f) The proliferation of gastric cancer cells in three groups; (g) The map of cell scratches in three groups; (h) The percentage change in scratch area in three groups; (i) The membrane penetration of cells in three groups by Transwell migration test; (j) The average number of transmembrane cells in three groups by Transwell migration test; (k) The membrane penetration of cells in three groups assessed by the Transwell invasion test; (l) The average number of transmembrane cells in three groups by the Transwell invasion test. Magnification: 40X (a, b, c, d); Magnification: 200X (g, i, k)
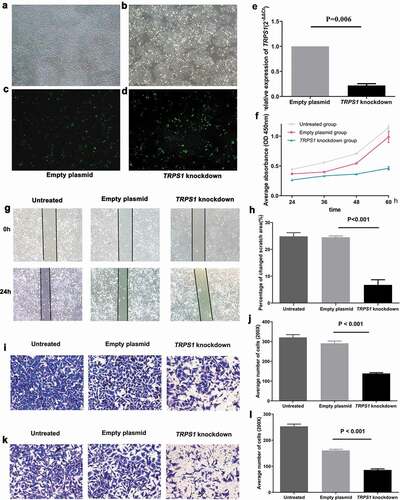
Figure 9. GO enrichment dot diagram and KEGG pathway histogram of TRPS1 and related genes. (a) The first ten items in biological processes (BP) of GO enrichment; (b) The first ten items in cellular components (CC) of GO enrichment; (c) The first ten items in molecular functions (MF) of GO enrichment; (d) The first twenty items in the KEGG pathway. GO, Gene Ontology; KEGG, Kyoto Encyclopedia of Genes and Genomes
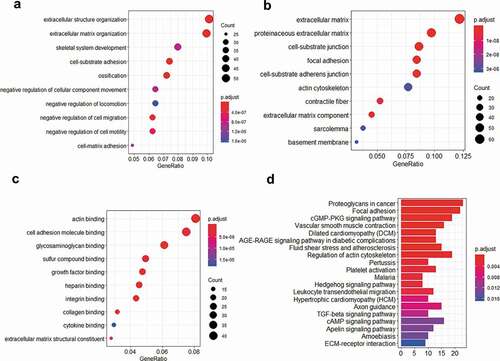
Figure 10. The PPI network of the related genes of TRPS1. (a) A total of 321 nodes and 849 edges were included in the PPI network; (b) The first thirty items with a maximum number of nodes. PPI, protein‑protein‑interaction
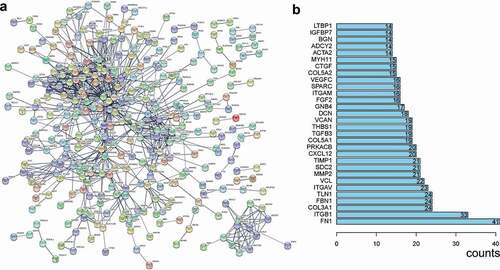
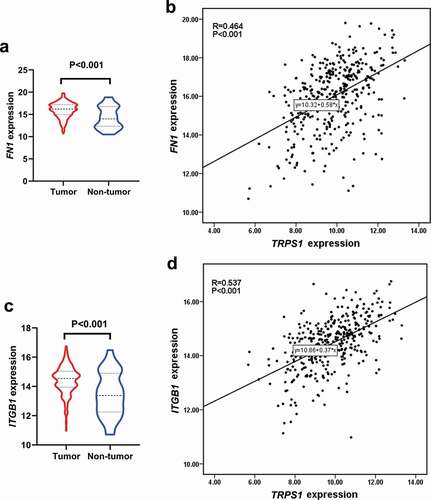
Figure 11. Expression of hub genes in gastric cancer and their correlation with TRPS1 based on the TCGA database. (a) Expression of FN1 in gastric cancer group compared with the non-tumor group; (b) Correlation between FN1 and TRPS1; (c) Expression of ITGB1 in the gastric cancer group compared with the non-tumor group; (d) Correlation between ITGB1 and TRPS1. TCGA, the cancer genome atlas; FN1, fibronectin 1; ITGB1, integrin β1
Supplemental Material
Download Zip (5.5 MB)Data and material sharing statement
The datasets used during the current study are available from the corresponding author on reasonable request.