Figures & data
Figure 1. Identification of BM-MSCs by flow cytometry
Analysis of the immunophenotype of BM-MSCs by flow cytometry. BM-MSCs were positive for CD29, CD105, CD44, and CD90, while negative for CD34 and CD45.
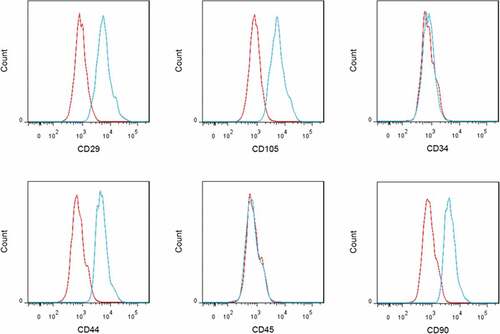
Figure 2. ICP/MAP ratio and MALAT1 expression in DMED rats with or without BM-MSCs implantation
Rats were divided into four groups: control (normal rats), DMED (DMED rats), DMED + PBS (DMED rats received PBS), and DMED + BM-MSCs (DMED rats received BM-MSCs). (a) The ICP/MAP ratio was calculated to assess the erectile function. (b) The expression changes of MALAT1 in corpus cavernosum tissues. N = 7 in each group. **P < 0.01, vs. Control; ##P < 0.01, vs. DMED+PBS.
Figure 3. MALAT1 overexpression promoted, whereas MALAT1 silencing inhibited the differentiation of BM-MSCs into ECs
(a) BM-MSCs were induced into ECs by VEGF (50 ng/mL) in vitro. The expression changes of MALAT1 and mRNA levels of EC-specific genes vWF, VE-cadherin, and eNOS in the VEGF-treated BM-MSCs on 0, 2nd, 4th and 7th d using qRT-PCR analysis. **P < 0.01, vs. 0 d. (b) The expression of MALAT1 and (c) mRNA levels of vWF, VE-cadherin, and eNOS in BM-MSCs transfected with MALAT1 overexpression vector or empty vector. The untreated BM-MSCs were used as the control. ##P < 0.01, vs. Vector. (d) The expression of MALAT1 and (e) mRNA levels of vWF, VE-cadherin, and eNOS in BM-MSCs transfected with si-MALAT1 or scramble control. The untreated BM-MSCs were used as the control. $$P < 0.01, vs. Scramble.
Figure 4. Effects of MALAT1 overexpression and silencing on expression of miR-206 and VEGFA
(a) RNA pull-down assay was performed to enrich miRNAs interacted with biotin-labeled MALAT1 (Bio-MALAT1) in BM-MSCs. The precipitated miR-206 level was detected by qRT-PCR. **P < 0.01, vs. Bio-NC. (b) Diagrammatic sketch of the binding site for MALAT1 and miR-206. Luciferase report assay delineated a reduction in luciferase activity of MALAT1 WT reporter after introduction of miR-206 mimic. ##P < 0.01, vs. mimic NC+MALAT1 WT. (c) Diagrammatic sketch of the binding site for VEGFA 3ʹ-UTR and miR-206. Luciferase report assay delineated a reduction in luciferase activity of VEGFA WT reporter after introduction of miR-206 mimic. ##P < 0.01, vs. mimic NC+VEGFA WT. (d) Relative expression of miR-206 and VEGFA determined by qRT-PCR and (e) VEGFA protein level determined by western blot in BM-MSCs transfected with MALAT1 overexpression vector or empty vector. The untreated BM-MSCs were used as the control. $$P < 0.01, vs. Vector. (F) Relative expression of miR-206 and VEGFA determined by qRT-PCR and (g) VEGFA protein level determined by western blot in BM-MSCs transfected with si-MALAT1 or scramble control. The untreated BM-MSCs were used as the control. &&P < 0.01, vs. Scramble.
Figure 5. miR-206 mimic and VEGFA silencing abrogated the MALAT1 overexpression-induced VEGFA, vWF, VE-cadherin, and eNOS
(a) VEGFA mRNA level, (b) VEGFA protein level, (c) vWF, VE-cadherin, and eNOS mRNA levels in BM-MSCs co-transfected with MALAT1 overexpression vector/empty vector and miR-206 mimic/mimic NC. **P < 0.01, vs. Vector+mimic NC; ##P < 0.01, vs. MALAT1+ mimic NC or Vector+miR-206 mimic. (d) VEGFA mRNA level, (e) VEGFA protein level, (f) vWF, VE-cadherin, and eNOS mRNA levels in BM-MSCs co-transfected with MALAT1 overexpression vector/empty vector and si-VEGFA/scramble siRNA control. The untreated BM-MSCs were used as the control. $$P < 0.01, vs. Vector+scramble; &&P < 0.01, vs. MALAT1+ scramble or Vector+si-VEGFA.
Figure 6. Effect of MALAT1 silencing on ED in vivo.
Rats were divided into six groups: control (normal rats), DMED (DMED rats), DMED+PBS (DMED rats received PBS), DMED+BM-MSCs (DMED rats received BM-MSCs), DMED+BM-MSCs-scramble (DMED rats received scramble shRNA lentiviruses-infected BM-MSCs), DMED+BM-MSCs-MALAT1 shRNA (DMED rats received MALAT1 shRNA lentiviruses-infected BM-MSCs). (a) The ICP/MAP ratio was calculated to assess the erectile function. (b) The expression of MALAT1, miR-206, and VEGF determined by qRT-PCR, (c) VEGFA protein level determined by western blot, and (d) mRNA levels of vWF, VE-cadherin and eNOS determined by qRT-PCR in corpus cavernosum tissues. N = 7 in each group. **P < 0.01, vs. Control; #P < 0.05, ##P < 0.01, vs. DMED+PBS; $P < 0.05, $$P < 0.01, vs. DMED+BM-MSCs-scramble.