
Figures & data
Figure 1. RFWD3 Interacts with ORC. (a). Co-immunoprecipitation (Co-IP) of HA-RFWD3 with T7-Orc1, the protein complex was analyzed by Western blotting. Actin serves as the loading control. “*” denotes cross-reacting band. (b). Immunoprecipitation (IP) of HA-RFWD3 in U2OS HA-RFWD3 WT stable cells, and the protein complex was analyzed by Western blotting. (c). Co-IP of HA-RFWD3 with T7-ORCA, the protein complex was analyzed by Western blotting. Orc2 serves as the positive control. Actin serves as the loading control. “*” denotes cross-reacting band. D. Immunoprecipitation (IP) of Orc1 in U2OS cells, and the protein complex was analyzed by Western blotting. Actin serves as the loading control. (e). Direct interaction of RFWD3 and Orc1 using purified proteins. (f). Direct interaction of RFWD3 and Orc2 using purified proteins
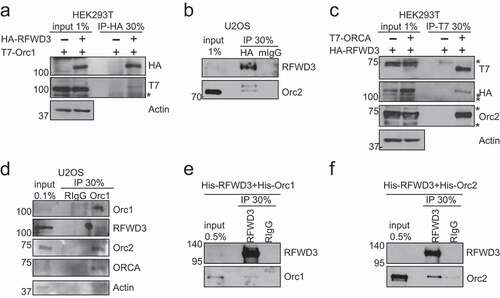
Figure 2. RFWD3 co-localized with MCM during S phase. (a). Schematic representation of the 2-6-3 CLTon locus in human U2OS cells. (b). Representative images of YFP-LacI, YFP-LacI-RFWD3 WT, or YFP-LacI-RFWD3-CA with MCM3 during G1 or S phase of the cell cycle. Scale bar denotes 15 µm. (c). Quantification of A. Cell number > 45. Values (means ± S.D.) are from four independent experiments
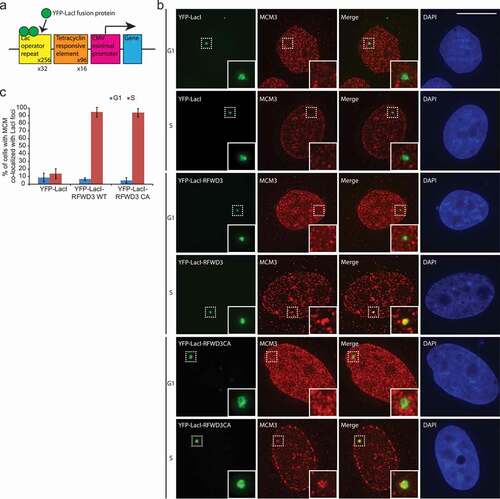
Figure 3. Overexpression of ORC stabilizes RFWD3. (a). Immunoblot analysis of whole cell extracts transfected with HA-RFWD3, along with vector or T7-tagged ORC/ORCA. “*” denotes T7-tagged ORC/ORCA. (b). Immunoblot analysis of whole cell extracts transfected with HA-RFWD3, along with vector or T7-tagged Orc2 WT and truncations. (c). Immunoblot analysis of whole cell extracts transfected with HA-RFWD3, in the absence or presence of T7-Orc2 and MG132. (d). Immunoblot analysis of whole cell extracts transfected with HA-RFWD3 WT or CA mutant, in the absence or presence of T7-Orc2
Figure 4. P53-dependent stabilization of RFWD3 by ORC. (a). Immunoblot analysis of HA-RFWD3 expression level in HCT116 WT, p21 null, and p53 null cells. “*”denotes cross-reacting band and loading control. (b). Immunoblot analysis of whole cell extracts (HCT116 WT or p21 null) transfected with HA-RFWD3 WT or CA mutant, in the absence or presence of T7-Orc2. (c). Immunoblot analysis of HCT116 p53 null whole cell extracts transfected with HA-RFWD3 WT or CA mutant, in the absence or presence of T7-Orc2, Nutilin-3, or MG132. (d). Immunoblot analysis of whole cell extracts from cells treated with control, Orc1 or Orc2 siRNAs. Varying concentrations (25%, 50%, and 100%) of whole-cell extracts treated with control siRNA (siGl3) are shown to provide information on the percentage of knockdown and the reduction of protein levels. (e). Immunoblot analysis of chromatin fractionation from cells treated with control, Orc1 or Orc2 siRNAs. S1 represents cytosolic fraction, S2 represents nuclear soluble fraction, P represents chromatin insoluble fraction
Figure 5. RFWD3 loss results in p53-dependent reduction of ORC/ORCA. (a-c). Immunoblot analysis of whole cell extracts from HCT116 WT (a), p53 null (b), or p21 null (c) cells treated with RFWD3 siRNAs. Varying concentrations (25%, 50%, and 100%) of whole-cell extracts treated with control siRNA (siGl3) are shown to provide information on the percentage of knockdown and the reduction of protein levels. (d-e). Immunoblot analysis of whole cell extracts from HCT116 WT (d) or p53 null (e) cells treated with RFWD3 siRNAs. Varying concentrations (25%, 50%, and 100%) of whole cell extracts treated with control siRNA (siGl3) are shown to provide information on the percentage of knockdown and the reduction of protein levels. (f). Immunoblot analysis of whole cell extracts from HCC38 cells treated with control or RFWD3 siRNAs. Varying concentrations (25%, 50%, and 100%) of whole cell extracts treated with control siRNA (siGl3) are shown to provide information on the percentage of knockdown and the reduction of protein levels. (g). Immunoblot analysis of whole cell extracts from cells treated with RFWD3 siRNAs in the absence or presence of p53 siRNA. Varying concentrations (25%, 50%, and 100%) of whole-cell extracts treated with control siRNA (siGl3) are shown to provide information on the percentage of knockdown and the reduction of protein levels. (h). Immunoblot analysis of whole cell extracts treated with RFWD3 siRNAs in the absence or presence of HA-RFWD3 WT or CA mutant. Varying concentrations (25%, 50%, and 100%) of whole-cell extracts treated with control siRNA (siGl3) are shown to provide information on the percentage of knockdown and the reduction of protein levels. (i). Immunoblot analysis of whole cell extracts from U2OS treated with different DNA damage agents. Cells were treated with 2 mM hydroxyurea (HU) for 4 h or 24 h, 1 µM of cisplatin for 4 h, or 20 ng/ml mitomycin C (MMC) for 4 h
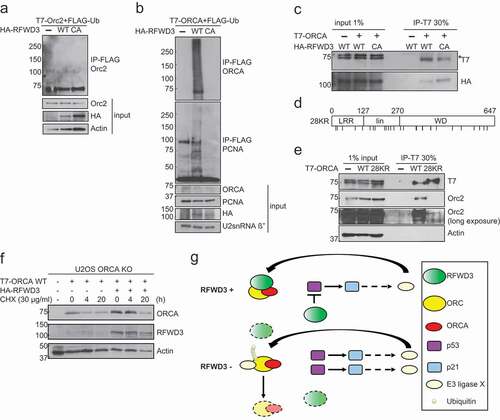
Figure 6. RFWD3 ubiquitinates ORCA. (a). In vivo ubiquitination assay in control, RFWD3 WT, or RFWD3 CA over-expressing samples co-transfected with T7-Orc2 and FLAG-ubiquitin. IP was performed with anti-FLAG beads and immunoblotting with Orc2 antibody. (b). In vivo ubiquitination assay in control, RFWD3 WT, or RFWD3 CA over-expressing samples co-transfected with T7-ORCA and FLAG-ubiquitin. PCNA serves as positive control for RFWD3-mediated ubiquitination. IP was performed with anti-FLAG beads and immunoblotting with ORCA antibody. (c). Co-IP of HA-RFWD3 WT or CA mutant with T7-ORCA. IP was performed with anti-T7 antibody, and the protein complex was analyzed by Western blotting. Orc2 serves as the positive control. Actin serves as the loading control “*” denotes cross-reacting band. (d). Schematic of ORCA 28KR mutant. (e). Co-IP of T7-ORCA WT or 28KR with Orc2, the protein complex was analyzed by Western blotting. Actin serves as the loading control. (f). Cycloheximide (CHX) chase assay showing T7-ORCA stability in the absence or presence of HA-RFWD3. Actin is served as the loading control. (g). The schematic of RFWD3 protects ORC/ORCA in a p53-dependent manner. In the absence of p53, ORC/ORCA are targeted by a p53-induced E3 ligase for degradation
Data availability statement
The authors confirm that the data supporting the findings of this study are available within the article and openly available in reference number [Citation5, Citation38].