
Figures & data
Figure 1. Chromosome clustering in RepoMan-depleted cells during prometaphase
(a) Confocal images of fixed U2OS cells arrested in prometaphase with 0.33 µM nocodazole, transfected with control siRNA (siC) or RepoMan siRNA (siRM). The chromosomal area, as visualized by DAPI, was quantified. Unpaired t Test: ****, p < 0.0001. (b) Confocal images of fixed RPE-1 cells treated and quantified as in (a). Since the variances were not equal, we used the Mann-Whitney test: ****, p < 0.0001.(c) Live-confocal imaging of U2OS cells in medium containing 0.33 µM nocodazole, overexpressing mCherry-Histone H2B, after transfection with siC or siRM. The time is shown in minutes and the onset of nuclear envelope breakdown is indicated (NEBD). (d) Confocal images of fixed U2OS cells arrested in prometaphase using 50 nM vinblastine, transfected with siC or siRM. The DAPI-stained area was quantified. Analyzed as in (a). Since the variances were not equal, we used the Mann-Whitney test: **, p < 0.01.(e) Confocal images of fixed U2OS cells arrested in prometaphase using 0.1 μg/ml colcemid, transfected with siC or siRM. Analyzed as in (a). Unpaired t Test; *, p < 0.05.(f) Confocal images of fixed U2OS cells arrested in prometaphase using 7.5 µM STLC, transfected with siC or siRM. Analyzed as in (a). Unpaired t Test: ns, not significant.(g) Confocal images of fixed U2OS cells arrested in prometaphase using 100 µM monastrol, transfected with siC or siRM. Analyzed as in (A). Unpaired t Test: ns, not significant.The results are shown as averages with error bars indicating the standard deviation. Three or more independent experiments were performed, one representative experiment is shown. The scale bars indicate 5 µm.
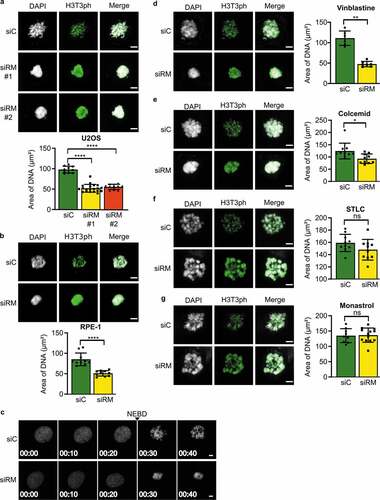
Figure 2. Chromosome clustering in RepoMan-depleted cells is reversible
(a) Confocal images of fixed U2OS cells treated with different concentrations of nocodazole and transfected with siC or siRM. Analyzed as in (a). Since not all the variances were equal, we used the Mann-Whitney test: ns, not significant; **, p < 0.01; *, p < 0.05. The results are shown as averages with error bars indicating the standard deviation. Three or more independent experiments were performed, one representative experiment is shown. (b) Confocal images of fixed U2OS cells treated with 0.33 µM nocodazole, transfected with siC or siRM, with or without an additional treatment for 1 h with 1 µM taxol. Analyzed as in (Fig. A). Unpaired t Test; ns, not significant; ****, p < 0.0001. The results are shown as averages with error bars indicating the standard deviation.(c) Confocal images of fixed U2OS cells treated with 0.33 µM nocodazole, transfected with siC or siRM, with or without a washout for 1 h in the presence of 7.5 µM STLC. Analyzed as in (a). Since not all the variances were equal, we used the Mann-Whitney test: ns, not significant; ***, p < 0.001. The results are shown as averages with error bars indicating the standard deviation.(d) Confocal images of fixed U2OS cells blocked in prometaphase with 0.33 µM nocodazole, transfected with siC or siRM and stained with anti-tubulin. The pictures were sorted according to the size of the MT asters and quantified. Chi-Square test: p < 0.0001.(e) Confocal images of fixed U2OS cells treated with 0.33 µM nocodazole, transfected with siC or siRM, with or without a washout in the presence of 7.5 µM STLC. The intensity of the spindle was measured using ImageJ. Unpaired t Test; ****, p < 0.0001. The results are shown as averages with error bars indicating the standard deviation. The scale bars indicate 5 µm.
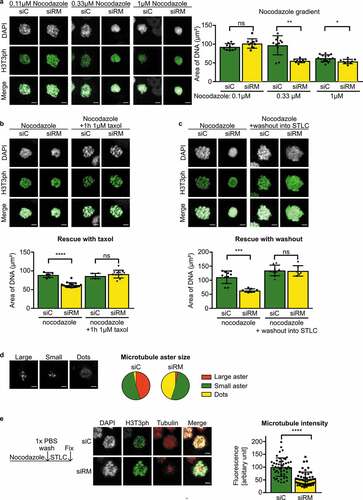
Figure 3. RepoMan interacts with essential microtubule-associated proteins
(a) The interactome of RepoMan based upon mass spectrometry, as previously described [Citation14,Citation26,Citation27]. Only the interactors involved in MT assembly are shown and clustered according to their function.(b) EGFP-β galactosidase or EGFP-RepoMan were transiently expressed in HEK293T cells for 48 h and blocked overnight in mitosis using 0.33 µM nocodazole. EGFP-based IPs were analyzed by immunoblotting for the indicated proteins. The data shown is representative of more than three experiments.
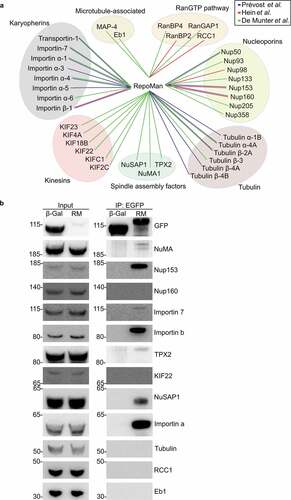
Figure 4. The depletion of RepoMan increases the NuSAP1-importin interaction in a phosphorylation-dependent manner
(a) EGFP-tagged NuSAP1, TPX2 or NuMA were transiently expressed in HEK293T cells for 48 h. In addition, the cells were transfected with siC or siRM for 48 h. The cells were blocked overnight in mitosis using 0.33 µM nocodazole. EGFP-based IPs were analyzed for the presence of importin α, importin β and importin 7. Three or more independent experiments were performed, one representative experiment is shown.(b) HEK293T cells were transfected with siC or siRM and EGFP-tagged NuSAP1 for 48 h and blocked in mitosis using 0.33 µM nocodazole. The phosphorylation status NuSAP1 after an EGFP-based IP was examined with pSP/pTP antibodies. The error bars indicate the standard deviation. Since the variances were not equal, we used the Mann-Whitney test: ***, p < 0.0001. The results are shown as averages with error bars indicating the standard deviation. The data shown is representative of 8 experiments.(c) HEK293T cells were transfected with EGFP-tagged NuSAP1 for 48h and blocked in mitosis using 0.33 µM. Cells were pre-treated with MG132 for 30 minutes and subsequently treated with the indicated kinase/phosphatase inhibitors for 1 h (5 µM hesperadine, 100 µM roscovitine) or 2 h (100 nM BI 2536, 25 nM calyculin A). The EGFP-based IPs were analyzed for the presence of importin α, importin β and importin 7. The data shown is representative of ≥ 3 experiments.
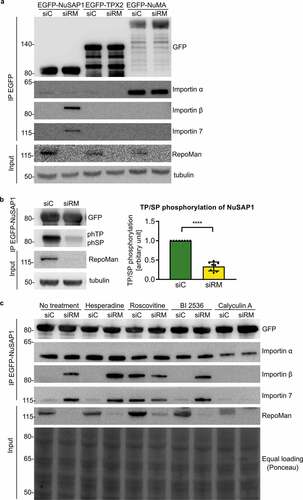
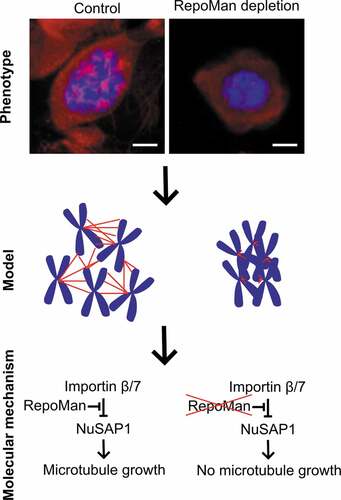
Figure 5. Model on the role of RepoMan in chromosome-dependent spindle assembly
The upper panel shows clustered chromosomes (blue) and a reduced microtubule size (red) in RepoMan depleted cells as compared to control cells, in the presence of limiting concentrations of an MT polymerization inhibitor. The model (middle panel) displays the link between chromosome dispersion and MTs. The lower panel shows the proposed molecular mechanism of reduced MT growth in RepoMan depleted cells, accounting for the observed chromosome-clustering phenotype. The scale bars indicate 5 µm.
Supplemental material
Supplemental Material
Download Zip (4.2 MB)Data Availability Statement
No datasets were generated during the current study.