Figures & data
Figure 1. BRG1 is recruited to DSBs and stimulates HR. (a) SWI/SNF complexes in somatic mammalian cells exist in two combinations: BAF and PBAF. The BAF complex can contain either the BRG1 or BRM ATPase (red), whereas the PBAF complex contains exclusively BRG1. Both complexes contain a group of core subunits (BAF47, BAF155, BAF170, orange) and a number of accessory factors of unknown function (yellow). Subunits marked with an asterisk (*) are known to be mutated in a variety of cancers [Citation20]. (b) U2OS cells were transduced with a retrovirus expressing ER*-HA-I-PpoI. These cells were treated for 12 h with tamoxifen (2 μM, + I-PpoI) or not (- I-PpoI), crosslinked, and nuclear extracts were prepared. Chromatin immunoprecipitation was performed for the indicated proteins. Quantitative PCR was performed to determine the amount of protein recruited at the specific locus (489 bp 3ʹ to the I-PpoI cut site in the rDNA region). Fold enrichment was calculated by dividing the percentage (%) of input of the + I-PpoI by the – I-PpoI. The % of input refers to the amount of DNA obtained from the immunoprecipitation of the given factor divided by the total amount of DNA (input). (c) HR efficiency was measured using the DR-U2OS system [Citation36]. DR-U2OS cells were transfected with the indicated siRNAs and 72 h later cells were transfected with an empty plasmid (-) or a plasmid encoding the I-SceI endonuclease (+). After 48 h, the % of GFP positive cells was measured by flow cytometry to assess HR efficiency. Results were normalized as siCTRL equal to 100%. All experiments were done in triplicate and graphs represent averages of three independent experiments ± SD (* p < 0.05, ** p < 0.01 by student t test)
![Figure 1. BRG1 is recruited to DSBs and stimulates HR. (a) SWI/SNF complexes in somatic mammalian cells exist in two combinations: BAF and PBAF. The BAF complex can contain either the BRG1 or BRM ATPase (red), whereas the PBAF complex contains exclusively BRG1. Both complexes contain a group of core subunits (BAF47, BAF155, BAF170, orange) and a number of accessory factors of unknown function (yellow). Subunits marked with an asterisk (*) are known to be mutated in a variety of cancers [Citation20]. (b) U2OS cells were transduced with a retrovirus expressing ER*-HA-I-PpoI. These cells were treated for 12 h with tamoxifen (2 μM, + I-PpoI) or not (- I-PpoI), crosslinked, and nuclear extracts were prepared. Chromatin immunoprecipitation was performed for the indicated proteins. Quantitative PCR was performed to determine the amount of protein recruited at the specific locus (489 bp 3ʹ to the I-PpoI cut site in the rDNA region). Fold enrichment was calculated by dividing the percentage (%) of input of the + I-PpoI by the – I-PpoI. The % of input refers to the amount of DNA obtained from the immunoprecipitation of the given factor divided by the total amount of DNA (input). (c) HR efficiency was measured using the DR-U2OS system [Citation36]. DR-U2OS cells were transfected with the indicated siRNAs and 72 h later cells were transfected with an empty plasmid (-) or a plasmid encoding the I-SceI endonuclease (+). After 48 h, the % of GFP positive cells was measured by flow cytometry to assess HR efficiency. Results were normalized as siCTRL equal to 100%. All experiments were done in triplicate and graphs represent averages of three independent experiments ± SD (* p < 0.05, ** p < 0.01 by student t test)](/cms/asset/7610d62c-0d8d-435d-8bfa-d1ae4cf40502/kccy_a_1831256_f0001_c.jpg)
Figure 2. Inactivation of BRG1 impairs the repair of DSBs and the activation of the ATR kinase. (a) Western blot analysis of parental U2OS cells (U2OS) that were transfected with an empty CRISPR/Cas9-containing plasmid (Cas9) or with the CRISPR/Cas9 containing a single guide DNA sequence targeting the exon 3 of the SMARCA4 gene (BRG1-KO) [Citation29]. Cells were selected with puromycin for 7 days after transfection and two single cell clones were isolated by cell sorting. (b) Control U2OS cells (Cas9) and U2OS cells lacking BRG1 (BRG1-KO) were subjected to the comet assay after treatment with camptothecin (+CPT, 1 μM for 1 h) and allowed to repair the damage for the indicated times. Then, cells were lysed, subjected to cell electrophoresis, and their DNA was stained. Representative images of the comets at 2 h after 1 h CPT treatment are shown. (c) Comet tail moment were calculated with ImageJ using the Open comet plug-in at the indicated times after treatment with CPT (1 μM for 1 h). (d) Control U2OS cells (Cas9) and U2OS cells lacking BRG1 (BRG1-KO) were grown in cover slips and treated with CPT (1 μM for 1 h) and allowed to repair their DNA for the indicated times. Cells were fixed at the indicated times and stained with an antibody against γH2AX. γH2AX foci images were acquired and the foci were counted with ImageJ. (e) Control U2OS cells (Cas9) and U2OS cells lacking BRG1 (BRG1-KO) were treated with 0.5 μM CPT for the indicated times, whole cell lysates were prepared, and subjected to SDS-PAGE. The levels of phosphorylated Chk1 (S345) and RPA (S4/8) were monitored with the indicated antibodies. GAPDH is used as a loading control. Representative images are shown. All experiments were done in triplicate and graphs represent averages of three independent experiments ± SD (* p < 0.05, ** p < 0.01, *** p < 0.001 by student t test)
![Figure 2. Inactivation of BRG1 impairs the repair of DSBs and the activation of the ATR kinase. (a) Western blot analysis of parental U2OS cells (U2OS) that were transfected with an empty CRISPR/Cas9-containing plasmid (Cas9) or with the CRISPR/Cas9 containing a single guide DNA sequence targeting the exon 3 of the SMARCA4 gene (BRG1-KO) [Citation29]. Cells were selected with puromycin for 7 days after transfection and two single cell clones were isolated by cell sorting. (b) Control U2OS cells (Cas9) and U2OS cells lacking BRG1 (BRG1-KO) were subjected to the comet assay after treatment with camptothecin (+CPT, 1 μM for 1 h) and allowed to repair the damage for the indicated times. Then, cells were lysed, subjected to cell electrophoresis, and their DNA was stained. Representative images of the comets at 2 h after 1 h CPT treatment are shown. (c) Comet tail moment were calculated with ImageJ using the Open comet plug-in at the indicated times after treatment with CPT (1 μM for 1 h). (d) Control U2OS cells (Cas9) and U2OS cells lacking BRG1 (BRG1-KO) were grown in cover slips and treated with CPT (1 μM for 1 h) and allowed to repair their DNA for the indicated times. Cells were fixed at the indicated times and stained with an antibody against γH2AX. γH2AX foci images were acquired and the foci were counted with ImageJ. (e) Control U2OS cells (Cas9) and U2OS cells lacking BRG1 (BRG1-KO) were treated with 0.5 μM CPT for the indicated times, whole cell lysates were prepared, and subjected to SDS-PAGE. The levels of phosphorylated Chk1 (S345) and RPA (S4/8) were monitored with the indicated antibodies. GAPDH is used as a loading control. Representative images are shown. All experiments were done in triplicate and graphs represent averages of three independent experiments ± SD (* p < 0.05, ** p < 0.01, *** p < 0.001 by student t test)](/cms/asset/4cd0310c-cb00-44b4-8d6c-10a282881496/kccy_a_1831256_f0002_c.jpg)
Figure 3. Inactivation of BRG1 impairs DNA end resection. (a) Inactivation of BRG1 impairs the generation of ssDNA after DNA damage. Control U2OS cells (Cas9) and U2OS cells lacking BRG1 (BRG1-KO) were grown on coverslips, incubated with BrdU (100 μM) for 48 h, then were not treated (NT), or treated with CPT (+CPT, 1 μM for 1 h), and allowed to perform repair for 4 h [Citation32]. Cells were then incubated with pre-extraction and extraction buffers and fixed with formaldehyde. Cells were immuno-labeled with antibodies against cyclin A and BrdU. The generation of ssDNA was measured by quantifying BrdU foci in cyclin A positive cells (late S/G2 cells), as the antibody only recognizes BrdU contained within ssDNA regions, which in this case arose due to DNA end resection after CPT treatment. The DNA was stained using DAPI. Images were acquired using a confocal microscope (60X oil). Quantification of ssDNA regions was performed using ImageJ and approximately 50 cells were counted by time point, per experiment. (b) Representative images are shown of control cells (Cas9) and cells lacking BRG1 (BRG1-KO) stained with a BrdU antibody following no treatment (NT), 1 h CPT treatment (+CPT, 1 µM), and 1 h CPT treatment followed by 4 h recovery (+CPT + 4 h, 1 µM). (c) Inactivation of BRG1 also impairs RPA foci-formation after DNA damage. Cells were treated as in (A) and stained with antibodies against cyclin A and RPA. CPT-induced RPA foci in cyclin A positive cells were quantified using ImageJ and approximately 50 cells were counted by time point, per experiment. (d) Representative images of RPA foci are shown of control cells (Cas9) and cells lacking BRG1 (BRG1-KO) as in (B). (e) Inactivation of BRG1 reduces the amount of CPT-induced chromatin-bound RPA. Chromatin-bound RPA was monitored by flow cytometry as a measure of DNA end resection [Citation33]. Cells were treated with CPT (0.5 μM for 1 h), followed by extraction of non-chromatin-bound RPA by cell permeabilization, followed by fixation with formaldehyde and immuno-labeling with an antibody against RPA. The DNA content of the cells was labeled with PI. Quantification of CPT-induced chromatin-bound RPA measured by flow cytometry in control cells (Cas9) and cells lacking BRG1 (BRG1-KO). Fold-increase is the ratio of the %+CPT/%NT as shown in Supplementary Figure S3A. (f) Quantification of CPT-induced chromatin-bound RAD51. Cells were treated with CPT as in (E) and allowed to repair the damage for 6 h, followed by permeabilization to remove the non-chromatin-bound RAD51, followed by fixation with formaldehyde. Chromatin-bound RAD51 was measured by flow cytometry. (g) Inactivation of BRG1 results in a decrease in RAD51 foci after CPT treatment. Cells were synchronized at late S/G2 phase by double thymidine block and 8 h after releasing the second thymidine block, cells were treated with CPT (1 μM for 1 h) and RAD51 foci were analyzed at the indicated times. Cells were fixed and immuno-labeled with an antibody against RAD51, and nuclei were stained with DAPI. Images were acquired and RAD51 nuclear foci were counted using ImageJ and approximately 50 cells were counted by time point, per experiment. (h) Representative confocal microscopy images of RAD51 foci are shown at the indicated times. All experiments were done in triplicate and graphs represent averages of three independent experiments ± SD (* p < 0.05, ** p < 0.01, *** p < 0.001 by student t test)
![Figure 3. Inactivation of BRG1 impairs DNA end resection. (a) Inactivation of BRG1 impairs the generation of ssDNA after DNA damage. Control U2OS cells (Cas9) and U2OS cells lacking BRG1 (BRG1-KO) were grown on coverslips, incubated with BrdU (100 μM) for 48 h, then were not treated (NT), or treated with CPT (+CPT, 1 μM for 1 h), and allowed to perform repair for 4 h [Citation32]. Cells were then incubated with pre-extraction and extraction buffers and fixed with formaldehyde. Cells were immuno-labeled with antibodies against cyclin A and BrdU. The generation of ssDNA was measured by quantifying BrdU foci in cyclin A positive cells (late S/G2 cells), as the antibody only recognizes BrdU contained within ssDNA regions, which in this case arose due to DNA end resection after CPT treatment. The DNA was stained using DAPI. Images were acquired using a confocal microscope (60X oil). Quantification of ssDNA regions was performed using ImageJ and approximately 50 cells were counted by time point, per experiment. (b) Representative images are shown of control cells (Cas9) and cells lacking BRG1 (BRG1-KO) stained with a BrdU antibody following no treatment (NT), 1 h CPT treatment (+CPT, 1 µM), and 1 h CPT treatment followed by 4 h recovery (+CPT + 4 h, 1 µM). (c) Inactivation of BRG1 also impairs RPA foci-formation after DNA damage. Cells were treated as in (A) and stained with antibodies against cyclin A and RPA. CPT-induced RPA foci in cyclin A positive cells were quantified using ImageJ and approximately 50 cells were counted by time point, per experiment. (d) Representative images of RPA foci are shown of control cells (Cas9) and cells lacking BRG1 (BRG1-KO) as in (B). (e) Inactivation of BRG1 reduces the amount of CPT-induced chromatin-bound RPA. Chromatin-bound RPA was monitored by flow cytometry as a measure of DNA end resection [Citation33]. Cells were treated with CPT (0.5 μM for 1 h), followed by extraction of non-chromatin-bound RPA by cell permeabilization, followed by fixation with formaldehyde and immuno-labeling with an antibody against RPA. The DNA content of the cells was labeled with PI. Quantification of CPT-induced chromatin-bound RPA measured by flow cytometry in control cells (Cas9) and cells lacking BRG1 (BRG1-KO). Fold-increase is the ratio of the %+CPT/%NT as shown in Supplementary Figure S3A. (f) Quantification of CPT-induced chromatin-bound RAD51. Cells were treated with CPT as in (E) and allowed to repair the damage for 6 h, followed by permeabilization to remove the non-chromatin-bound RAD51, followed by fixation with formaldehyde. Chromatin-bound RAD51 was measured by flow cytometry. (g) Inactivation of BRG1 results in a decrease in RAD51 foci after CPT treatment. Cells were synchronized at late S/G2 phase by double thymidine block and 8 h after releasing the second thymidine block, cells were treated with CPT (1 μM for 1 h) and RAD51 foci were analyzed at the indicated times. Cells were fixed and immuno-labeled with an antibody against RAD51, and nuclei were stained with DAPI. Images were acquired and RAD51 nuclear foci were counted using ImageJ and approximately 50 cells were counted by time point, per experiment. (h) Representative confocal microscopy images of RAD51 foci are shown at the indicated times. All experiments were done in triplicate and graphs represent averages of three independent experiments ± SD (* p < 0.05, ** p < 0.01, *** p < 0.001 by student t test)](/cms/asset/bdd7d5f6-d43f-445d-86cb-5dec7f9b2838/kccy_a_1831256_f0003_c.jpg)
Figure 4. Inactivation of BRG1 impairs the recruitment of CtIP to DSBs. (a) Live cell confocal microscopy was used to monitor the recruitment of GFP-CtIP to laser-induced DSBs. Control cells (Cas9) and cells lacking BRG1 (BRG1-KO) were transfected with GFP-CtIP and 24 h post-transfection cells were incubated with BrdU (10 μM for 24 h). Laser micro irradiation experiments were performed using a 405 nm laser. Images were collected before laser irradiation and every 10 sec after irradiation for 10 min. Representative images are shown. (b) Quantification of the recruitment of GFP-CtIP was performed using ImageJ. A minimum of 20 cells were measured per genotype. Graph represent averages ± SD. (c) Inactivation of BRG1 impairs CtIP foci formation after CPT. Control cells (Cas9) and cells lacking BRG1 (BRG1-KO) were synchronized at late S/G2 phase of the cell cycle by double thymidine block. Cells were released from the second thymidine block and allowed cell cycle progression for 8 h (late G2). Cells were then treated with CPT (1 μM for 1 h). Cells were fixed and immuno-labeled with an antibody against CtIP, and nuclei were stained with DAPI. Images were acquired and CtIP nuclear foci were counted using ImageJ and approximately 50 cells were counted by time point, per experiment. (d) Representative confocal microscopy images of CtIP foci are shown at the indicated times. (e) Control cells (Cas9) and cells lacking BRG1 (BRG1-KO) were transduced with a retrovirus expressing ER*-HA-I-PpoI. These cells were treated for 12 h with tamoxifen (2 μM, + I-PpoI) or not (- I-PpoI), crosslinked and nuclear extracts were prepared. Chromatin immunoprecipitation was performed for histone H3. Quantitative PCR was performed to determine the amount of histone H3 present at the specific locus (489 bp 3ʹ to the I-PpoI cut site in the rDNA region). Fold enrichment was calculated by dividing the percentage (%) of input of the + I-PpoI by the – I-PpoI. The % of input refers to the amount of DNA obtained from the immunoprecipitation of the given factor divided by the total amount of DNA (input). All experiments were done in triplicate and graphs represent averages of three independent experiments ± SD (* p < 0.05, ** p < 0.01, *** p < 0.001 by student t test)
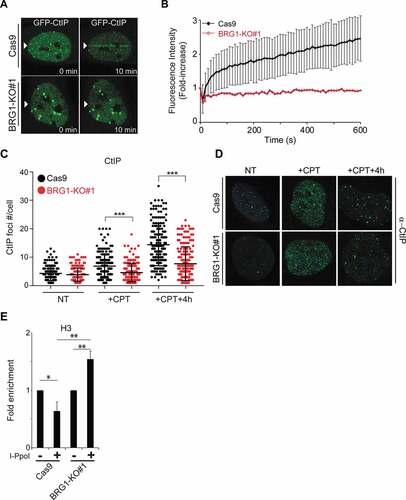
Figure 5. Inactivation of BRG1 renders cells sensitive to chemotherapeutic agents. Control cells (Cas9) and cells lacking BRG1 (BRG1-KO) were treated with increasing concentrations of (a) bleomycin, (b) camptothecin, (c) cisplatin, or (d) etoposide for 4 days and cell viability was measured by the MTT assay. All experiments were done in triplicate and each point represents averages of three independent experiments ± SD (* p < 0.05, ** p < 0.01, *** p < 0.001 by student t test)
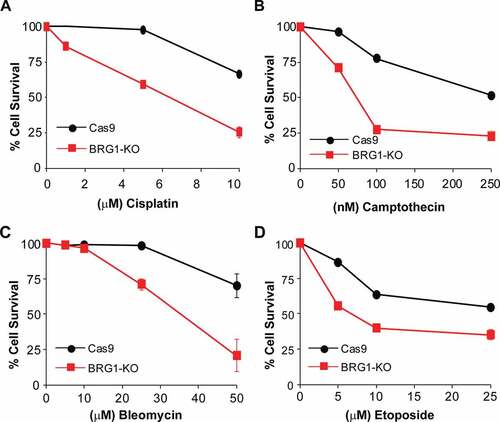
Figure 6. Proposed model for BRG1 function in DNA end resection and HR. First, the DSB is recognized by the MRN complex and the ATM kinase. This step also activates the ATM kinase, which phosphorylates the Chk2 kinase and histone H2AX (red). This step is followed by the recruitment of a SWI/SNF chromatin remodeling complex containing BRG1 (blue) that reduces nucleosome density at the DSB. After this chromatin remodeling step, the CtIP nuclease is recruited to the DSB and DNA end resection occurs. DNA end resection generates ssDNA, which is coated by RPA (green) and this structure activates the ATR kinase, which phosphorylates the Chk1 kinase. These ssDNA regions are later coated by RAD51 (light blue), which mediates the homology search and strand invasion steps of HR. Inactivation of BRG1 impairs the recruitment of the CtIP nuclease, and thus DNA end resection, ATR activation, RAD51 foci-formation, and HR