Figures & data
Table 1. Description of samples and basic pre-processed data summary
Figure 1. Preparation of ovarian cancer scRNA-seq data for CNA analysis. (a) Overview of scRNA-seq to CNA analysis. (b) Highly variable genes in LG1P (top 10 variable genes are labeled). (c) Elbow plot of LG1P principal components. (d) Identified cell clusters in LG1P using t-SNE clustering of scRNA-seq data (e) Top 10 markers that define each cell cluster in LG1P. Non-epithelial cell cluster (green) shows the upregulation of collagen genes (COL1A1, COL1A2, COL5A1, COL6A3). Column color labels match the clustered cell colors in panel D. (f) Proportion of epithelial and non-epithelial cells in each sample
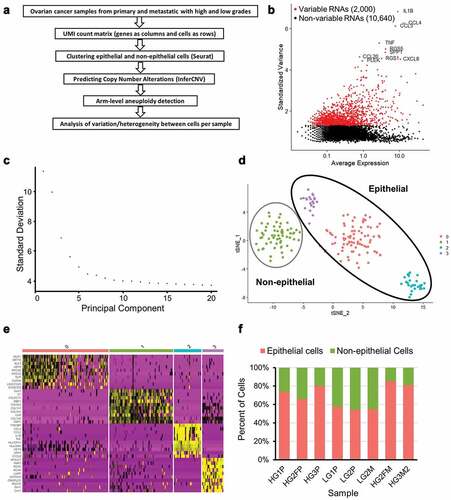
Figure 2. Copy-number alterations in epithelial cancer cells exceed normal control cells. (a) Heatmap illustrating the relative expression intensities across each chromosome from HG3P. Region-normalized expression values for non-epithelial cells are plotted in the top heatmap and the epithelial cells are plotted in the lower heatmap, with genes ordered from left to right across the chromosomes. The non-epithelial cell expression data is effectively subtracted from the epithelial cells to yield differences. Red blocks indicate chromosomal region amplification and blue blocks show chromosomal deletions. Expression differences across chromosomal segments were used to predict CNA regions. (b) Enlarged image of chr8 which highlights deletion in chr8p and amplification in chr8q. (c) Predicted CNAs from scRNA-seq data were summed across chromosome arms to derive what percentage of each arm was lost (blue) or gained (red). An example from HG3P is shown. (d) Comparison of normal, non-epithelial cells from sample HG3P to normal, non-epithelial cells from sample HG1P, by CNA prediction using methods identical to panel C
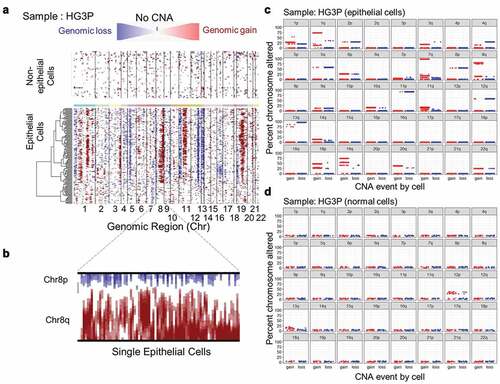
Figure 3. Spontaneous ploidy alterations. (a) Tumors were thresholded for average ploidy by finding where InferCNV states were centered, using a sliding window of fractional genome states. An example of a triploid genome (left, HG1P) and diploid genome (right, HG2FP) are shown. Geometric means of each ploidy fraction are overlaid over single-cell data. (b) A triploid high-grade serous ovarian tumor (HG1P) with estimations of diploid and tetraploid cells. (c) Diploid high-grade serous ovarian tumors with estimations of haploid and triploid cells. Left: HG2FP, right: HG3P
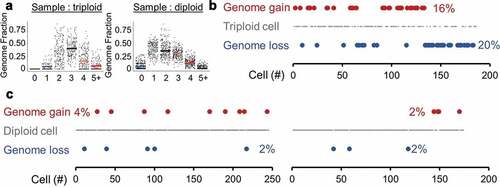
Figure 4. Aneuploidy and CNA estimates per cell. (a) Violin and boxplots of number of aneuploid events from all primary tumor samples studied, wherein aneuploidy is defined as arm-level alterations covering > 50% of the coding region of a chromosome arm (ANOVA, all post hoc to normal P < 2.2e-16) (b) Copy number alterations (CNAs) detected within each primary tumor chromosome arm are summed across the genome. (c) Tumor-metastasis pairs are compared for detectable aneuploidy rates per cell. (d) Tumor-metastasis pairs are compared for detectable CNA rates per cell. Blue ** P < 0.01 and *** P < 0.001 with a reduction in metastasis, red *** P < 0.001 with an increase in metastasis
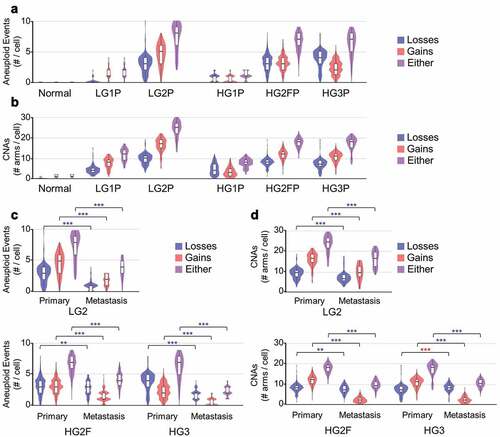
Figure 5. Cell to cell CNA heterogeneity. Groups of 10 cells were compared for CNA heterogeneity for all samples. A Euclidean distance metric was determined for each set of 10 cells and represents Y-axis quantitation. (a) Primary tumor epithelial ovarian cancer cells exhibited 3–6 fold more heterogeneity than normal cells. (b) FairSubset groups from the BECN1± tumor (HG2FP) are compared to equally sized cell groups of all other tumors, for CNA heterogeneity. (c) LG2P was compared to LG2M for CNA heterogeneity. (d) Metastatic tumor cells for HG2 (left) and HG3 (right) were compared for CNA heterogeneity with primary tumor cells. ***P < 0.001 by Wilcoxon rank sum test
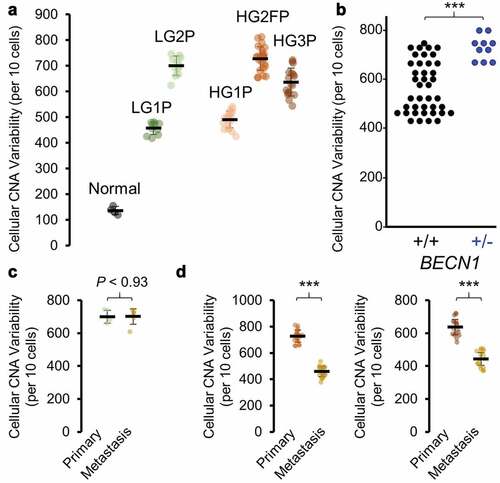
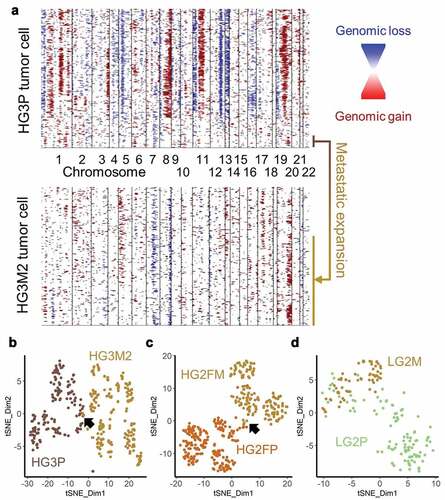
Figure 6. Cells with metastatic CNAs identified in primary tumor. (a) InferCNV plots of HG3 primary (upper plot) and metastatic (lower plot) tumors, with a shared population highlighted (b) HG3P (light brown) were clustered by t-SNE with HG3M2 (gold). Arrow indicates a small overlap. (c) HG2FP (brown) were clustered by t-SNE with HG2FM (gold). Arrow indicates a small overlap. (d) LG2P (green) CNAs were clustered by t-SNE with LG2M (gold)