Figures & data
Figure 1. ERK is activated in myogenic cells during muscle regeneration. (a) Scheme of R26R-EKAREV/Pax7-CreERT2 mice. (b) Experimental scheme of Cre-mediated recombination and in vivo imaging of skeletal muscle regeneration. (c) Layout for the in vivo imaging system. The muscle under the imaging window was observed with a two-photon microscope repetitively. (d) Representative images of regenerating muscles expressing EKAREV and tdKeima at 0, 1, 2, 3, and 5 days post-injury (dpi). The nuclei of Pax7 lineage cells (satellite cell-derived myogenic cells) express EKAREV are shown in green, while the myofibers that existed before injury express tdKeima and are shown in magenta (top panels). Note that the nuclei of Pax7 lineage cells include the myonuclei of myotubes or myofibers at 5 dpi. Biceps femoris muscles were imaged at indicated time points; maximum intensity projection images of 30 µm z-stack with 2 µm intervals are shown. EKAREV-NLS was used to monitor ERK activity in the nucleus. ERK activity (FRET/CFP) images of myogenic cells shown in the intensity-modulated display (IMD) mode (bottom panels). (e) Averaged nuclear density of myogenic cells calculated from the z-stack images (bars, SDs; N = 3 mice for each day; *p < 0.05). (f and g) Bee swarm plot (f) and histogram (g) of ERK activity (FRET/CFP) in myogenic cells. Each color represents data from a single mouse in (f) (bars, averages; N = 3 mice for each day; ***p < 0.001)
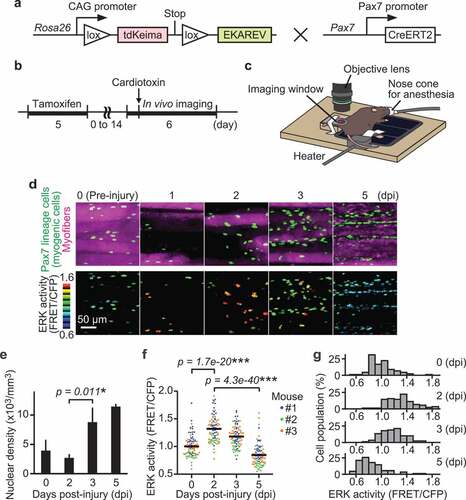
Figure 2. Instantaneous ERK activity regulates migration in some but not all myogenic cells. (a) Representative time-lapse images of myogenic cells (white dots) and their cell tracks (pseudo-colored lines) (left). FRET/CFP ratio images of myogenic cells (IMD mode dots) and their cell tracks (white lines) (right). (b) Migration speed of myogenic cells, which was calculated from the displacement of EKAREV-NLS centroids and divided by the time. Data for cells with more than one hour of tracking is shown. Each color represents data from a single mouse (bars, averages; N = 3 mice for each day; ***p < 0.001). (c) Representative cell tracks for 2 hours. X-axis corresponds to the long axis of myofibers. (d) Scatter plot of normalized ERK activity (FRET/CFP) against migration speed in migrating myogenic cells. Myogenic cells with a speed of more than 7 µm/hr were defined as “migrating” and taken into account. ERK activity was normalized by the averaged ERK activity of each mouse. Each color represents data from a single mouse (N = 3 mice). (e) Representative images of myogenic cells (white dots) and their cell tracks (two-colored lines). Yellow lines indicate cell tracks during the first two hours. Blue lines indicate cell tracks during the latter two hours after treatment with DMSO (1 mL/kg) or a MEK inhibitor (PD0325901, 5 mg/kg). (f) The difference in migration speed and ERK activity in myogenic cells, calculated by subtracting values before MEKi treatment from values after MEKi treatment. Gray dashed lines indicate the median of ERK activity and migration speed in DMSO group. Percentages of each cell groups after MEKi treatment are indicated in the scatter plot. Histograms of the difference in migration speed and ERK activity are shown at the top and right side of the figure, respectively (N = 4 mice for DMSO group; N = 3 mice for MEKi group)
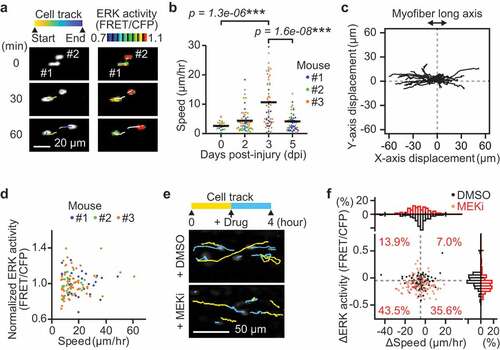
Figure 3. ERK activation is required for G1/S transition in myogenic cells. (a) Experimental scheme of cre-mediated recombination and tissue clearing. Mice were injected with a MEK inhibitor (PD0325901, 5 mg/kg) at 2 and 2.5 dpi. MEK inhibitor-injected mice and uninjected controls were fixed at 3 dpi. (b–d) Representative images (b), averaged nuclear density (c), percentage (d) of myogenic cells expressing Fucci in mouse muscle regenerating regions. Magenta and green colors represent cells in G0/G1 and S/G2/M phase, respectively. All data above were obtained from the same experiment described in (a) (bars, SDs; N = 3 mice for each group; *p < 0.05)
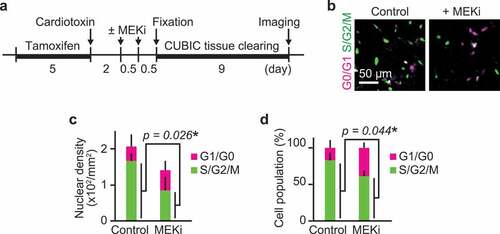
Figure 4. Migration speed of myogenic cells increases in S/G2 phase. (a) Representative images of myogenic cells expressing Fucci at 0, 2, 3, and 5 dpi. Biceps femoris muscles were imaged as indicated time points, and shown in maximum intensity projection images of 100 µm z-stack with 2 µm intervals. Magenta and green dots indicate cells in G0/G1 phase and those in S/G2/M phase, respectively. (b) Averaged nuclear densities of myogenic cells expressing Fucci calculated from the z-stack images (bars, SDs; N = 3 mice for each day; ***p < 0.001). (c) Representative images of cell trajectories for 4 hours at 3 dpi. Magenta and green lines indicate the trajectories of cells in G0/G1 phase and those in S/G2/M phase, respectively. (d) Migration speed of myogenic cells expressing Fucci during each cell cycle phase at 3 dpi. Cells in the G0 and G1 phase were determined by the intensity of mCherry-hCdt1 (Figure S3(a,b)). Cells in the M phase was discriminated from cells in S/G2 phase by cytosolic distribution and subsequent disappearance of mVenus-hGeminin (Figure S3(c)). Each color represents data from a single mouse (bars, averages; N = 3 mice for each day; ***p < 0.001)
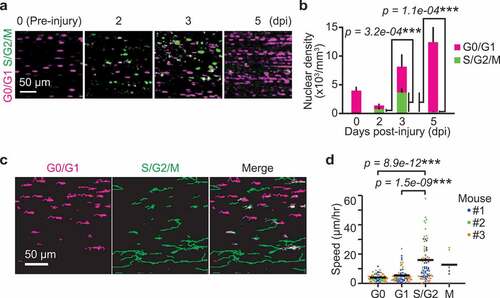
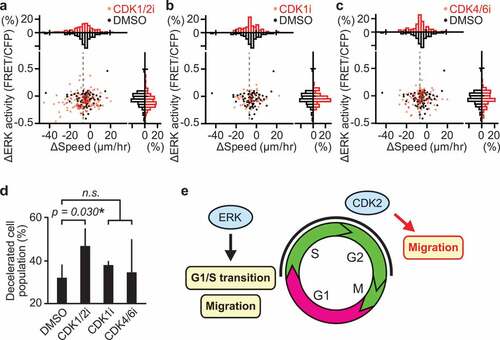
Figure 5. CDK2 promotes myogenic cell migration during muscle regeneration. (a–c) Changes in migration speed and in ERK activity in myogenic cells, calculated by subtracting values before the drug treatment from values after the drug treatment. Gray dashed lines indicate -7 µm/hr, which was chosen as the threshold for classifying cells as decelerated. Histograms of the difference in migration speed and ERK activity are shown at the top and right side of the figure, respectively (N = 4 mice for DMSO group; N = 4 mice for CDK1/2i group; N = 3 mice for CDK1i group; N = 3 mice for CDK4/6i group). Mice expressing EKAREV-NLS in myogenic cells were injected intravenously with DMSO (1 mL/kg), CDK1/2 inhibitor (roscovitine, 0.05 mg/kg), CDK1 inhibitor (RO-3306, 1 mg/kg), or CDK4/6 inhibitor (palbociclib, 1 mg/kg) during in vivo imaging at 3 dpi. (d) Percentage of cells classified as decelerated after DMSO or CDK inhibitors. Migrating myogenic cells that decreased their speed more than 7 µm/hr are defined as “decelerated” and taken into account (bars, SDs; *p < 0.05; n.s., not significant). (e) Schematic model of cell cycle progression and cell migration by ERK and CDK2 in myogenic cells during muscle regeneration