Figures & data
Figure 1. PTX treatment could rescue the downregulation of MEG3 in MCF-7 and MDA-MB-231 cells. (a and b) The level of MEG3 in breast cancer tissues and cell lines. (c) The overall survival rate in breast cancer patients with high MEG3 expression compared to patients with low MEG3 expression was evaluated using Kaplan-Meier overall survival curve. (d and e) QRT-PCR analysis for the effect of PTX on MEG3 level in MCF-7 and MDA-MB-231 cells. *P < 0.05
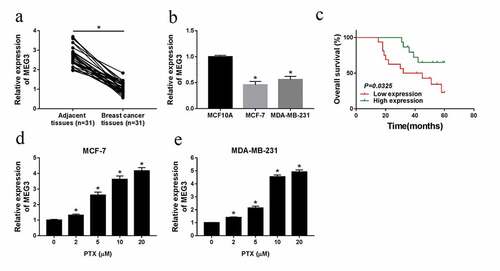
Figure 2. Overexpression of MEG3 could promote cell apoptosis, suppress proliferation, migration, invasion, and the IC50 of PTX in MCF-7 and MDA-MB-231 cells. (a-h) MEG3 or vector was transfected into MCF-7 and MDA-MB-231 cells, (a) and qRT-PCR analysis for the level of MEG3 in vitro. (b and c) The IC50 of PTX after MEG3 upregulation in breast cancer cells. (d and e) The impact of MEG3 overexpression on cell proliferation in MCF-7 and MDA-MB-231 cells. (f) Flow cytometric analysis for the change of cell proliferation after transfection with MEG3 or vector. (g and h) The ability of cell migration and invasion in breast cancer cells. *P < 0.05
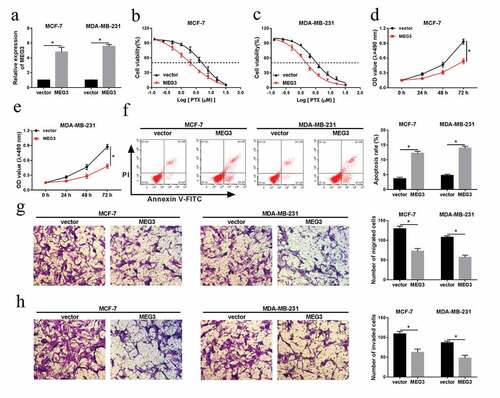
Figure 3. MEG3 was a target of miR-4513. (a) The predictive binding sites between miR-4513 and MEG3. (b and c) Dual-luciferase reporter analysis for the interaction between miR-4513 and MEG3 in MCF-7 and MDA-MB-231 cells. (d and e) The level of miR-4513 in breast cancer cells and cell lines. (f) The knockdown efficiency of si-MEG3 in MCF-7 and MDA-MB-231 cells. (g) QRT-PCR analysis for the roles of si-MEG3 and MEG3 in miR-4513 level. *P < 0.05
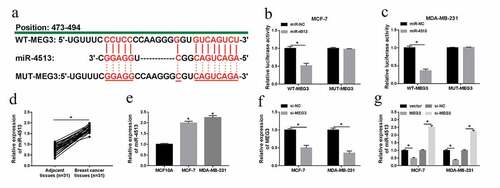
Figure 4. The effect of miR-4513 inhibitor on cell behaviors and the IC50 of PTX was abolished by MEG3 deletion in breast cancer cells
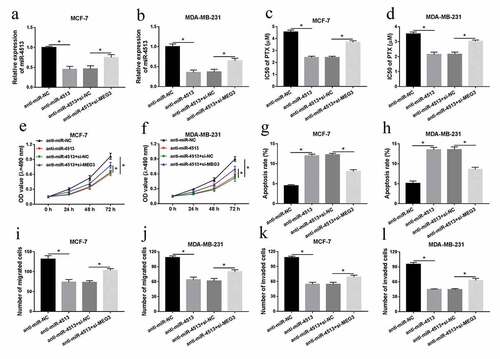
Figure 5. PBLD was a target of miR-4513. (a) Partial complementary sequences between miR-4513 and PBLD. (b and c) The luciferase activity analysis for the luciferase activity after co-transfection with WT-PBLD or MUT-PBLD and miR-4513 or miR-NC in breast cancer cells. (d-g) The mRNA and protein levels of PBLD in breast cancer tissues and cell lines. (h) The acceleratory efficiency of miR-4513 mimic on miR-4513 level in MCF-7 and MDA-MB-231 cells. (i and j) QRT-PCR and western blot analyses for the mRNA and protein levels of PBLD in breast cancer cells after transfection with miR-4513 or anti-miR-4513. *P < 0.05
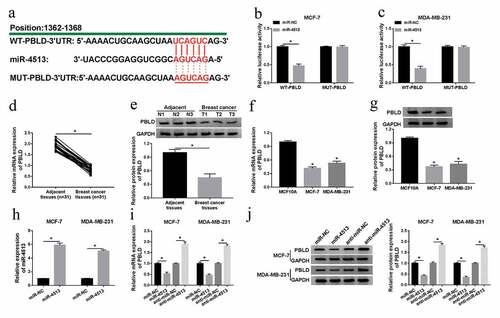
Figure 6. The impact of PBLD upregulation on cell behavior and the IC50 of PTX was abrogated by co-transfection with miR-4513 in vitro. (a-j) MCF-7 and MDA-MB-231 cells were transfected with vector, PBLD, PBLD+miR-NC, or PBLD+miR-4513, respectively, (a-d) qRT-PCR and western blot analyses for the alteration of the mRNA and protein levels of PBLD in vitro. (e) The role of PBLD and miR-4513 in the IC50 of PTX in breast cancer cells. (f and g) MTT assay for measuring the change of cell proliferation in MCF-7 and MDA-MB-231 cells. (h) Flow cytometry estimation for the level of cell apoptotic rate in vitro. (i and j) The capacities of cell migration and invasion of MCF-7 and MDA-MB-231 cells treated accordingly. *P < 0.05
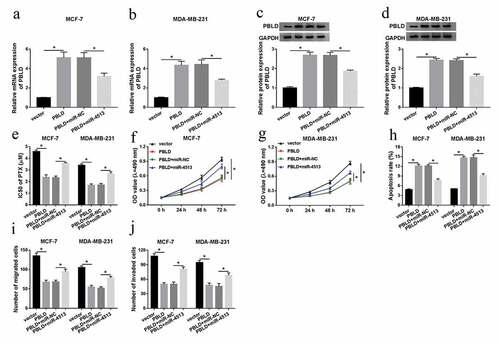
Figure 7. MEG3 regulated PBLD by miR-4513. (a-d) MiR-NC, miR-4513, miR-4513+ vector, or miR-4513+ MEG3 was introduced into MCF-7 and MDA-MB-231 cells, respectively. QRT-PCR and western blot analyses for the alteration of mRNA and protein levels of PBLD in breast cancer cells. (e) The summary diagram was shown. *P < 0.05
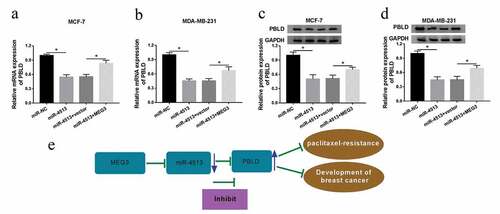
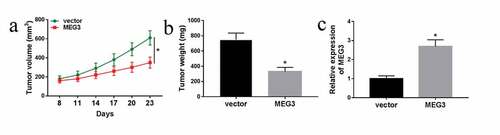
Figure 8. Overexpression of MEG3 suppressed tumor growthin vivo. (a-c) MDA-MB-231 cells stable transfected with MEG3 were injected into nude mice for 8 days. (a) The tumor volume was measured every 3 days for 23 days after the injection. (b) The tumor weight was measused after the mices was sacrificed. (c) MEG3 expression in the transplanted tumors was examined. *P< 0.05