
Figures & data
Figure 1. A hydrophobic-motif-dependent aggregative activity of Cep63 and Cep152. (a), 3D-SIM analysis for immunostained HEK293 cells co-infected with adenoviruses expressing mCherry-Cep63 and mGFP-Cep152. The location of endogenous centrioles is marked by anti-Cep192 signals. DAPI, chromosomal DNA stained by 4',6-diamidino-2-phenylindole. Arrowheads, a pair of endogenous centrioles. Asterisk, a ring-like aggregate found away from the two centrioles indicated by arrowheads. Note the cooperative generation of pericentrosomal aggregates by mCherry-Cep63 and mGFP-Cep152. Boxes, areas of enlargement. Scale bar, 2 µm. (b), CLEM analysis for HEK293 cells expressing mCherry-Cep63 and mGFP-Cep152. The endogenous centriole is marked by anti-Cep192 signal. Electron micrographs show an amorphous matrix-like aggregate around a centriole (asterisk). Box, area of enlargement. (c–e), Confocal microscopy, quantification, and immunoblotting analyses of HEK293 cells infected with adenoviruses expressing either WT Cep63 and Cep152 or their respective 4A and 5A hydrophobic mutants. Boxes in (c), areas of enlargement. Quantification in (d) was carried out by determining the total signal intensities (relative) of 12 randomly chosen fields (224.92 μm x 224.92 μm/field) from each sample using 2.5D intensity plots generated by the ZEN black software. Each microscopic field contains >50 cells. The data in (d) are shown in mean ± s. d. Exemplary intensity profiles for 2.5D plots are shown in Fig. S1B. ****, P < 0.0001 (unpaired two-tailed t-test). Immunoblots in (e) show the levels of WT and mutant forms of Cep63 and Cep152 expressed in the transfected cells. CBB, Coomassie Brilliant Blue–stained membrane. (f–h), 3D-SIM, quantification, and immunoblotting analyses of cells expressing endogenous promoter (Pendo)–controlled mCherry-Cep63-sil and mGFP-Cep152-sil and depleted of endogenous Cep63 and Cep152 by RNAi. Arrowheads in (f) indicate active, dot-state Plk4 signals. The data in (g) are shown in mean ± s. d. *, P < 0.05, ****, P < 0.0001 (unpaired two-tailed t-test). CBB, Coomassie Brilliant Blue–stained membrane
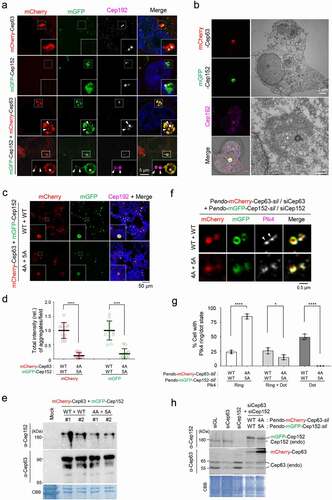
Figure 2. Phase-separating activity of Cep63 and Cep152 in vivo. (a), FRAP analysis of adenovirus-expressed mCherry-Cep63 and mGFP-Cep152 aggregates generated in HEK293 cells. Images were acquired for 600 seconds at 2-second intervals. Representative confocal images acquired at the indicated time points are provided. Quantified relative signal intensities are shown in mean ± s.d. (n = 8 independent aggregates). (b), Time-lapse imaging showing the fusion of adenovirus-expressed mCherry-Cep63 and mGFP-Cep152 aggregates formed in U2OS cells. Images were acquired at 40-second intervals. The image at each time point was generated by projecting all z-stacks (greater than 21 stacks, 300-nm intervals). White arrowheads indicate two small condensate-like aggregates, which fuse into the bigger condensate-like aggregate (the middle sphere). Representative images are shown. Six out of 6 independent time-lapse experiments showed more than one fusion event during the course of experiment. (c), Quantification of confocal images for immunostained U2OS cells treated with either culture medium (mock) or 6% 1,6-hexanediol for the indicated lengths of time. Representative images are provided in Fig S2A. Relative fluorescence intensities for endogenous Cep63, Cep152, γ-tubulin, and glutamylated tubulin signals are shown in mean ± s.d. (n ≥ 50 cells/sample obtained from two independent experiments). ****, P < 0.0001 (one-way ANOVA). (d), 3D-SIM analyses for immunostained U2OS cells stably expressing endogenous promoter (Pendo)–controlled mCherry-Cep63-sil (WT or 4A) and mGFP-Cep152-sil (WT or 5A) and treated with centrinone and siRNAs for Cep63 and Cep152 (see the schematic diagram). Cep192, a centriole marker. N, nucleus. Arrowheads, nanoscale mCherry-Cep63•mGFP-Cep152 aggregates detected in cytosol after centrinone treatment. Note a greatly reduced number of aggregates in the 4A + 5A cells. (e), The cells in (d) were lysed in PBS and incubated in the presence of 5% glycerol. The resulting samples were subjected to confocal imaging and quantification. The total number of condensates (weak condensates in the 4A + 5A sample were marked by arrowheads) observed from seven randomly chosen fields for each group is provided, and the data are shown in mean ± s. d. (f), Confocal imaging and quantification of samples prepared from U2OS cell lysates transfected (to express in multiple copies) with Pendo-mCherry-Cep63-sil and Pendo-mGFP-Cep152-sil under Cep63 and Cep152 RNAi conditions. The lysates were incubated in PBS or PBS + 5% glycerol. The total number of condensates (arrowheads) observed from twelve randomly chosen fields for each sample is provided and the data are shown in mean ± s. d. Arrowhead, a small condensate observed in the 4A + 5A mutant sample
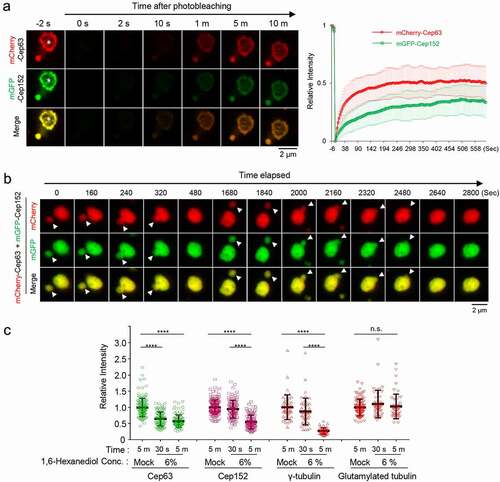
Figure 2. (Continued)
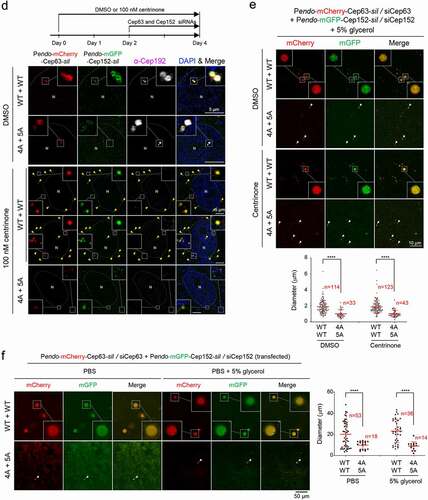
Figure 3. Formation of two morphologically distinct Cep63•Cep152 self-assemblies in vitro. (a), Schematic diagram showing the Cep63 (424–541)•Cep152 (1205–1295) complex and its corresponding 4A•5A hydrophobic mutant and purified proteins stained with Coomassie Brilliant Blue (CBB). (b and c), The proteins (125 μM) in (a) were incubated in an assembly buffer (20 mM Tris-HCl [pH 7.5], 150 mM NaCl, 0.5 mM TCEP) + 5% glycerol at 4 °C overnight and subjected to bright-field microscopy (b). The self-assemblies were stained with an anti-His antibody to confirm that spherical condensates are made of the His-Cep63 (424–541)•Cep152 (1205–1295) complex (c). A series of z-stack images in (c) revealing a spherical morphology is shown. The diameters of spherical assemblies were quantified and the results are shown in mean ± s.d. (n = 321 condensates obtained from two independent experiments). (d), 3D-SIM analysis of FITC-conjugated His-Cep63 (424–541)•Cep152 (1205–1295) self-assemblies generated either in a PCR tube (i.e., 3D space) or on a poly-L-lysine-coated slide glass (i.e., 2D surface) for 14 hours. Right panels, a series of z-stack images showing either a spherical (top) or cylindrical (bottom) morphology. Note of the different diameters for different z-stacks of the spherical assembly (top). 3D surface-rendered movies are provided in Movie S3. (e), 3D-SIM analysis of His-Cep63 (424–541)•Cep152 (1205–1295) self-assemblies generated in a 3D space in the presence of the indicated 5% polyethylene glycols (PEGs) for 14 hours
![Figure 3. Formation of two morphologically distinct Cep63•Cep152 self-assemblies in vitro. (a), Schematic diagram showing the Cep63 (424–541)•Cep152 (1205–1295) complex and its corresponding 4A•5A hydrophobic mutant and purified proteins stained with Coomassie Brilliant Blue (CBB). (b and c), The proteins (125 μM) in (a) were incubated in an assembly buffer (20 mM Tris-HCl [pH 7.5], 150 mM NaCl, 0.5 mM TCEP) + 5% glycerol at 4 °C overnight and subjected to bright-field microscopy (b). The self-assemblies were stained with an anti-His antibody to confirm that spherical condensates are made of the His-Cep63 (424–541)•Cep152 (1205–1295) complex (c). A series of z-stack images in (c) revealing a spherical morphology is shown. The diameters of spherical assemblies were quantified and the results are shown in mean ± s.d. (n = 321 condensates obtained from two independent experiments). (d), 3D-SIM analysis of FITC-conjugated His-Cep63 (424–541)•Cep152 (1205–1295) self-assemblies generated either in a PCR tube (i.e., 3D space) or on a poly-L-lysine-coated slide glass (i.e., 2D surface) for 14 hours. Right panels, a series of z-stack images showing either a spherical (top) or cylindrical (bottom) morphology. Note of the different diameters for different z-stacks of the spherical assembly (top). 3D surface-rendered movies are provided in Movie S3. (e), 3D-SIM analysis of His-Cep63 (424–541)•Cep152 (1205–1295) self-assemblies generated in a 3D space in the presence of the indicated 5% polyethylene glycols (PEGs) for 14 hours](/cms/asset/057759f5-723c-485d-87c2-cbbcc78a2f67/kccy_a_1843777_f0003_oc.jpg)
Figure 4. Dynamic nature of spherical assemblies or condensates generated by the Cep63 (424–541)•Cep152 (1205–1295) complex in vitro. A and B, The fluorescence recovery after photobleaching (FRAP) analysis for His-Cep63 (424–541)•Cep152 (1205–1295)-generated hollowed spherical assemblies (a) or inside-filled spherical condensates formed in the presence of 5% PEG 3350 (b). Both the turnover of its constituents with those in the surroundings (left) and their internal rearrangement within a condensate (right) were determined. Images were taken every three seconds for 360 seconds and representative images at indicated time points were provided on top. To calculate the efficiency of internal rearrangement, relative signal intensities were determined by dividing the intensities in photobleached area (“b”) by the intensities in their corresponding unbleached area (“a”). Graphs are shown in mean ± s.d. (n = 23 for turnover and n = 15 for internal rearrangement for [a]. n = 14 for turnover and n = 13 for internal rearrangement for [b]). The red dotted lines indicate the level of the fluorescence intensity immediately after photobleaching
![Figure 4. Dynamic nature of spherical assemblies or condensates generated by the Cep63 (424–541)•Cep152 (1205–1295) complex in vitro. A and B, The fluorescence recovery after photobleaching (FRAP) analysis for His-Cep63 (424–541)•Cep152 (1205–1295)-generated hollowed spherical assemblies (a) or inside-filled spherical condensates formed in the presence of 5% PEG 3350 (b). Both the turnover of its constituents with those in the surroundings (left) and their internal rearrangement within a condensate (right) were determined. Images were taken every three seconds for 360 seconds and representative images at indicated time points were provided on top. To calculate the efficiency of internal rearrangement, relative signal intensities were determined by dividing the intensities in photobleached area (“b”) by the intensities in their corresponding unbleached area (“a”). Graphs are shown in mean ± s.d. (n = 23 for turnover and n = 15 for internal rearrangement for [a]. n = 14 for turnover and n = 13 for internal rearrangement for [b]). The red dotted lines indicate the level of the fluorescence intensity immediately after photobleaching](/cms/asset/fd7a686a-f5b6-41e7-83c7-0fe6e92c2014/kccy_a_1843777_f0004_oc.jpg)
Figure 5. Model illustrating the versatile capacity of Cep63 and Cep152 to phase-separate into morphologically distinct higher-order self-assemblies. Cep63 and Cep152 interact with each other and generate a heterotetrameric complex through the Cep63 (424–541) and Cep152 (1205–1272) regions [Citation8]. In the presence of the intact hydrophobic motifs (one each from Cep63 and Cep152), the resulting complex can phase-separate into a condensate or an organized assembly, as evidenced by its ability to generate a densely deposited matrix-like aggregate that exhibits dynamic turnover and fusion and undergoes an internal rearrangement of its constituents. Our data demonstrate that the complex possesses a versatile capacity to generate inside-filled condensates (in the presence of a macromolecular crowder), hollow spherical assemblies (in a 3D space), or cylindrical assemblies (in a 2D surface) under different physicochemical and spatial cues. We propose that an unknown element(s) may dictate the Cep63•Cep152 complex to assume a cylindrical localization pattern around a centriole in vivo. A arrow denotes that a spherical condensate may convert to a vesicle-like, hollow spherical assembly, although its transition to a solid-like state cannot be ruled out
![Figure 5. Model illustrating the versatile capacity of Cep63 and Cep152 to phase-separate into morphologically distinct higher-order self-assemblies. Cep63 and Cep152 interact with each other and generate a heterotetrameric complex through the Cep63 (424–541) and Cep152 (1205–1272) regions [Citation8]. In the presence of the intact hydrophobic motifs (one each from Cep63 and Cep152), the resulting complex can phase-separate into a condensate or an organized assembly, as evidenced by its ability to generate a densely deposited matrix-like aggregate that exhibits dynamic turnover and fusion and undergoes an internal rearrangement of its constituents. Our data demonstrate that the complex possesses a versatile capacity to generate inside-filled condensates (in the presence of a macromolecular crowder), hollow spherical assemblies (in a 3D space), or cylindrical assemblies (in a 2D surface) under different physicochemical and spatial cues. We propose that an unknown element(s) may dictate the Cep63•Cep152 complex to assume a cylindrical localization pattern around a centriole in vivo. A arrow denotes that a spherical condensate may convert to a vesicle-like, hollow spherical assembly, although its transition to a solid-like state cannot be ruled out](/cms/asset/a045090a-f77e-4151-8f66-a6cbb407c7b4/kccy_a_1843777_f0005_oc.jpg)
Supplemental Material
Download Zip (21.9 MB)Data availability
All the data are in the manuscript.