Figures & data
Figure 1. Induction of α-SMA expression
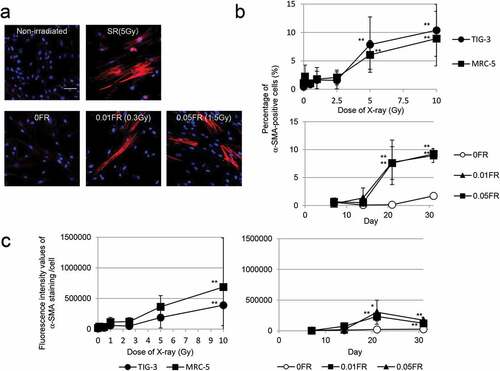
Figure 2. Association of DDR with myofibroblast induction
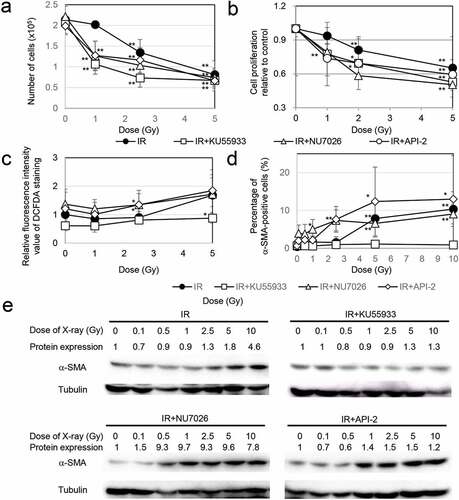
Figure 3. Growth inhibition enhanced myofibroblast induction
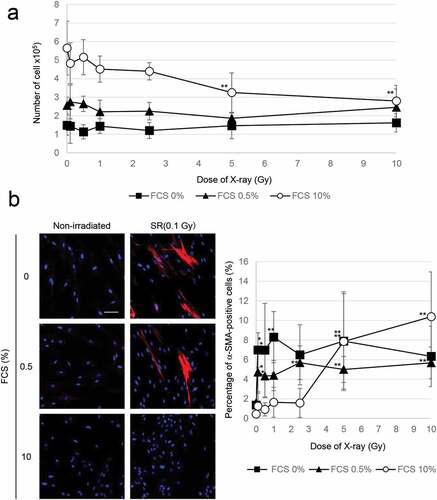
Figure 4. ROS generation FACS results for DCFDA staining 24 h after SR in TIG-3 cells that were either nonirradiated (dotted line) or irradiated (solid line) at the indicated doses. The relative fluorescence intensity values of DCFDA staining were normalized to nonirradiated controls. Asterisk indicates a significant increase in fluorescence intensity value of DCFDA staining compared with nonirradiated control cells
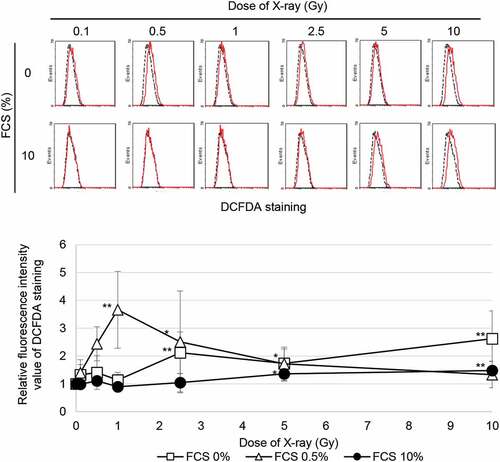
Figure 5. The role of EC and ACA on cell growth, ROS production, and α-SMA staining pattern after irradiation
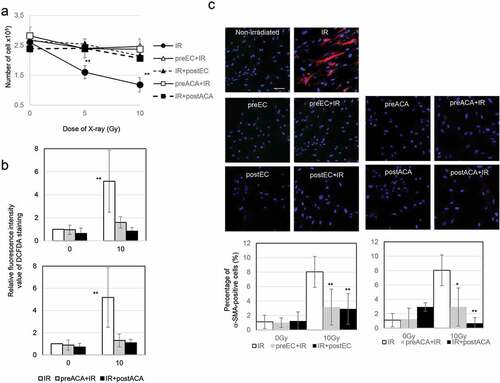
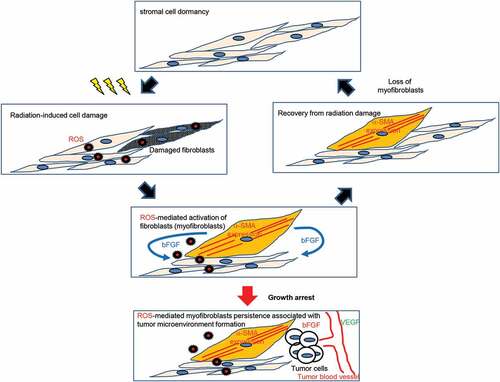
Figure 6. Schematic representation of myofibroblast clearance and persistence following radiation