Figures & data
Table 1. The sequences of all primers used in qRT-PCR
Figure 1. Establishment of a mouse model of liver fibrosis and the detection of lnc-LFAR1, MTF-1, and GDNF expressions. (a) Hematoxylin-eosin (HE) and Sirius Red staining were applied to observe the severity of liver fibrosis in mice (scale: 6 μm), n = 5; Immunohistochemistry was applied to test the expression of α-SMA in mouse liver tissues (scale: 6 μm), n = 5. (b-g) The kits were applied to test the contents of ALT, AST, T-BIL, D-BIL, GGT, and ALP in mouse serum samples, n = 15. (h) qRT-PCR was conducted to test the expressions of lnc-LFAR1, GDNF, MTF-1, and α-SMA in hepatic stellate cells (HSCs) isolated from mouse liver tissues, n = 5. (i) Western blot was applied to quantify the protein levels of α-SMA, GDNF, and MTF-1 in HSCs isolated from mouse liver tissues, n = 5. Experiments were performed in triplicate. Silymarin treatment group was used as a positive control. ***P < 0.001 vs. Sham group. ##P < 0.01, ###P < 0.001 vs. Hepatic fibrosis group
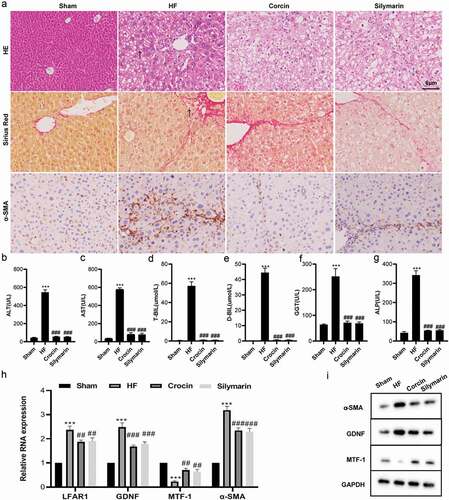
Figure 2. Effect of lnc-LFAR1 on MTF-1, GDNF and α-SMA expressions. pcDNA-LFAR1 or sh-MTF-1 was transfected into HSCs from the Drug groups in Experiment 1, respectively. (a&b) Detection of lnc-LFAR1, MTF-1, GDNF and α-SMA expressions. pcDNA-LFAR1 or sh-LFAR1 was transfected into HSCs derived from the sham group in Experiment 1, respectively. (c) Detection of lnc-LFAR1, MTF-1, GDNF and α-SMA expressions. (d) Detection of the protein levels of MTF-1, GDNF and α-SMA. pcDNA-MTF-1 or sh-MTF-1 was transfected into HSCs derived from the sham group in Experiment 1, respectively. (e) Detection of lnc-LFAR1, MTF-1, GDNF and α-SMA expressions. (f) Detection of the protein levels of MTF-1, GDNF and α-SMA. **P < 0.01, ***P < 0.001 vs. HF group or sh-NC (Negative control) group. Experiments were performed in triplicate. ##P < 0.01, ###P < 0.001 vs. Drug + pcDNA-NC or pcDNA-NC group
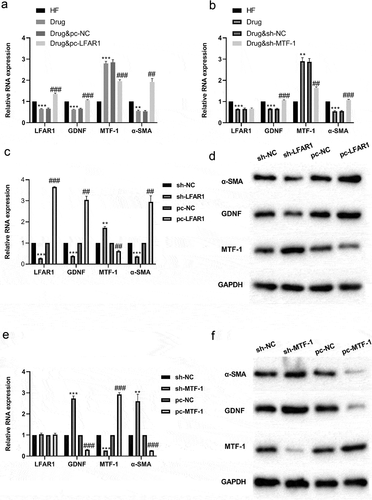
Figure 3. Experimental verification of the lnc-LFAR1-MTF-1-GDNF regulation mechanism. (a&b) Dual-luciferase reporter gene assay was conducted to evaluate the regulation of MTF-1 and lnc-LFAR1 on the luciferase activity of GDNF. (c) Chromatin immunoprecipitation (ChIP) experiments were applied to analyze the binding of MTF-1 to the GDNF promoter region. (d) RNA pull-down and (e) RNA Immunoprecipitation assays were applied to verify the interaction between lnc-LFAR1 and MTF-1. pcDNA-MTF-1, pcDNA-LFAR1, and pcDNA-MTF-1 + pcDNA-LFAR1 were transfected into LX2 cell lines, respectively. (f&g) Detection of α-SMA expression. Experiments were performed in triplicate. *P < 0.05 vs. Negative control group or MTF-1 group or pc-NC group. **P < 0.01, ***P < 0.001 vs. IgG group. #P < 0.05 vs. pc-MTF-1 group. &P < 0.05 vs. pc-NC group
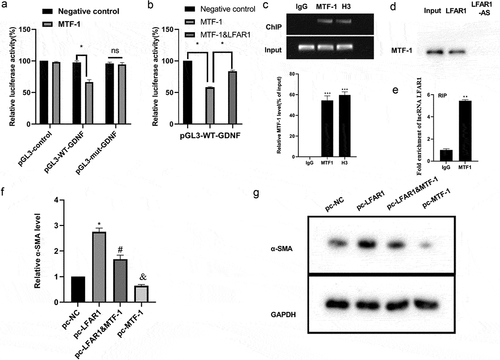
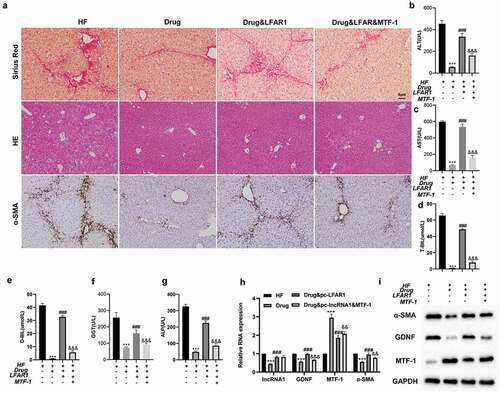
Figure 4. Crocin repressed the activation of HSCs through the lnc-LFAR1/MTF-1/GDNF axis. Ad-LFAR1, Ad-LFAR1 + Ad-MTF-1 were injected into mice via the tail vein. The experiments were divided into these groups: HF, HF + Drug, HF + Drug + Ad-LFAR1, and HF + Drug + Ad-LFAR1 + Ad-MTF-1. (a) HE staining, Sirius Red staining, and immunohistochemical assays were applied to assess the degree of liver fibrosis (scale: 6 μm). (b-g) Different kits were applied to test the contents of ALT, AST, T-BIL, D-BIL, GGT, and ALP. Mouse liver tissues were obtained and HSCs were isolated from liver tissues. (h) Detection of lnc-LFAR1, GDNF, MTF-1and α-SMA expressions. (i) Detection of the protein levels of α-SMA, GDNF and MTF-1. Experiments were performed in triplicate. ***P < 0.001 vs. HF group. ###P < 0.001 vs. HF + Drug group. &&P < 0.01, &&P < 0.001 vs. HF + Drug + Ad-LFAR1 group