Figures & data
Scheme 1. Schematic diagram of preparation and sustained release mechanism of the GL nanocomposite drug
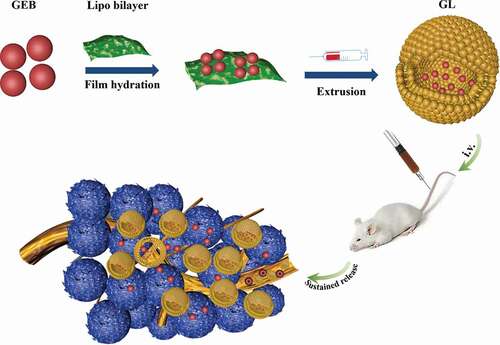
Figure 1. Characterization of nanoliposome
(a): The particle size of GEB and GL; (b): PDI of GEB and GL particle size; (c): Surface Zeta potentials of GEB and GL; (d): TEM picture of GL (10000×).
Figure 2. Study on encapsulation efficiency and release behavior of nanoliposome
(a): GL encapsulation efficiency under different oval-biliary ratios (LE/CH); (b): Cumulative release curves of GEB and GL.
Figure 3. Effects of GL on viability and apoptosis of A549 cells and 16HBE cells
(a): Effects of different concentrations of GEB and GL on viability of A549 cells and 16HBE cells; (b): Effects of GEB and GL on apoptosis of A549 cells; (c): Flow cytometry of GEB and GL on A549 cells. * P < 0.05, ** P < 0.01.
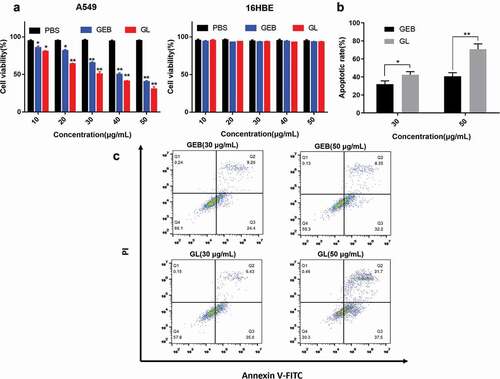
Figure 4. Colony formation, scratch and Transwell invasion assays of A549 cells
(a): Cell proliferation in the colony formation assay; (b): Cell migration ability in scratch assay (200×); (c): Cell invasion ability in Transwell assay (100×). * P < 0.05, ** P < 0.01.
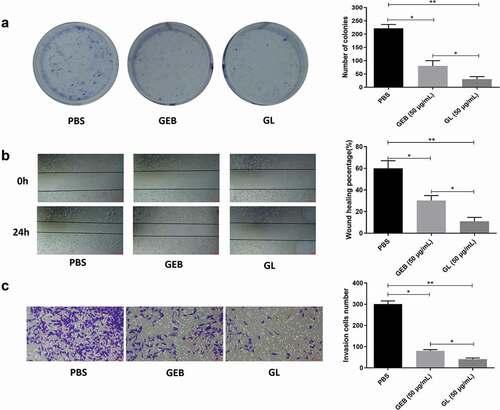
Figure 5. Cell cycle comparisons among different treatment groups
(a,b): Flow cytometry diagram of tumor cell cycle after cells were treated with different concentrations of GEB and GL, respectively; (c,d): Tumor cell cycle distribution after cells were treated with different concentrations of GEB and GL, respectively; €: Distribution of tumor cell cycle after cells were treated with 50 μg/mL GEB and 50 μg/mL GL, respectively. * P < 0.05, ** P < 0.01.
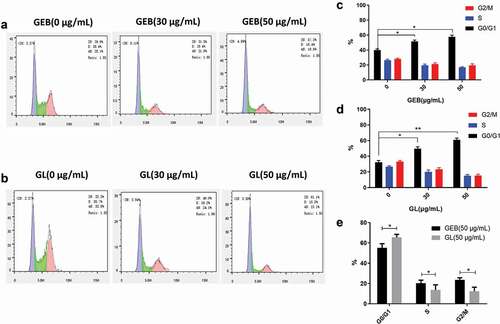
Figure 6. Evaluation of anti-cancer effect in vivo of different treatment groups
(a): Tumor size curve changes over treatment time, and the treatments of GEB and GL are over 14 d (* P < 0.05, ** P < 0.01); (b): The mean tumor weights of the PBS, GEB, and GL groups after 14 d; (c): Average tumor volume after 14 d in PBS, GEB and GL groups; (d): Digital images of tumors after 14 d in PBS, GEB, and GL groups; €: Mean body weight of mice in PBS, GEB and GL groups during treatment.
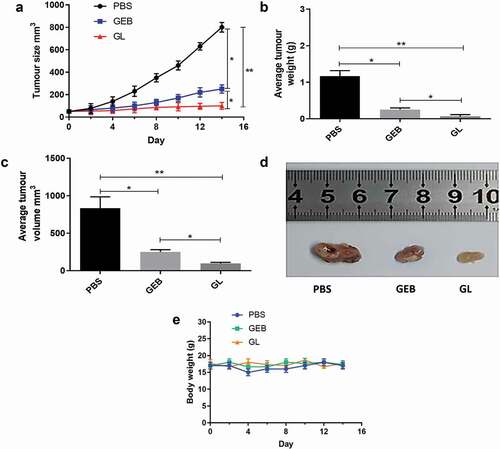
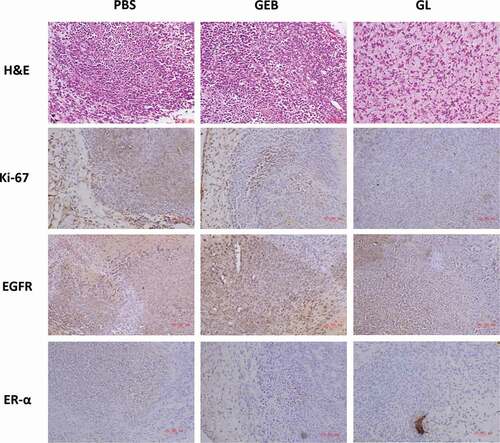
Figure 7. H&E staining and immunohistochemical evaluation of tumor tissue
Optical micrographs of H&E staining and immunohistochemical indexes (Ki-67, EGFR and ER-α) of tumor tissue in PBS, GEB and GL groups are presented.