Figures & data
Figure 1. Microwave ablation (MWA) combined with anti-PD-1/anti-CTLA-4 increased the survival time and enhanced immunity against tumor recurrence of mice. A: Kaplan-Meier Curves showed the survival rates of untreated mice and mice treated with Blockade, MWA, and Combination (MWA plus Blockade) (n = 10 for each group). *P < 0.05, vs. Untreated; ^^P < 0.01, vs. MWA; ###P < 0.001, vs. Blockade. B: The Cox regression proportional hazards model calculated the survival of mice. C: Tumor volumes of mice survived longer than 10 days after tumor recurrence, and the tumors were monitored every 5 days. D: Tumors were shown in the control group and the experimental group (n = 6 for Experimental group; n = 5 for Control group. Repeat three times for each independent experiment). &&P < 0.01, vs. Control. PD-1: Programmed cell protein 1; CTLA-4: Cytotoxic T-lymphocyte-associated protein 4
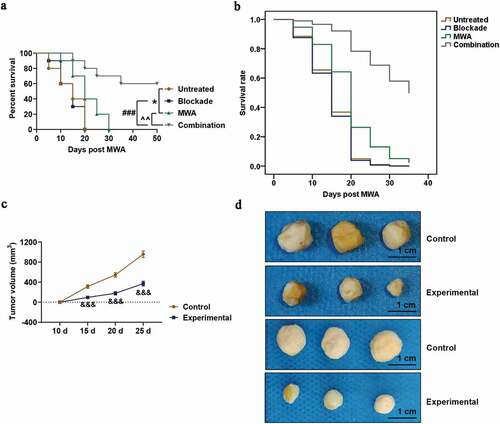
Figure 2. Combined treatment of MWA with anti-PD-1/anti-CTLA-4 increased the intratumoral infiltration of cytotoxic CD8+ T lymphocyte cell into tumors, but not CD4+ T helper cells. A: Representative microphotographs of CD4+ in Untreated group, Blockade group, MWA group and Combination group, under 100 × and 200 × magnification. Staining of immunohistochemistry was conducted on the tumor specimens harvested 7 days after the treatment. n = 5. B: Representative microphotographs of CD8+ in Untreated group, Blockade group, MWA group and Combination group, under 100 × and 200 × magnification. Staining of immunohistochemistry was performed on the tumor specimens harvested 7 days after the treatment. n = 5. Each experiment was independently conducted in triplicate
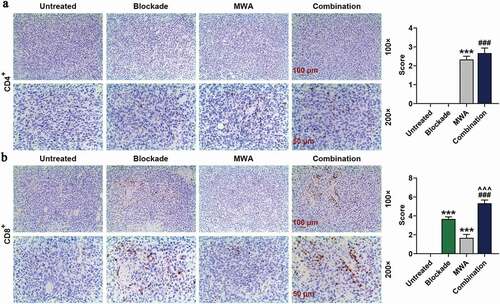
Figure 3. MWA with anti-PD-1/anti-CTLA-4 enhanced systemic T-cell immune responses. Mononuclear cells were available from the spleens of mice on day 7 after the treatment and used for flow cytometry analysis. n = 5. CD4+ T cell and CD8+ T cell in Untreated group, Blockade group, MWA group and Combination group were analyzed using flow cytometry. **P < 0.01, vs. Untreated; ^^P < 0.01, vs. MWA; ###P< 0.001, vs. Blockade. Each experiment was independently conducted in triplicate
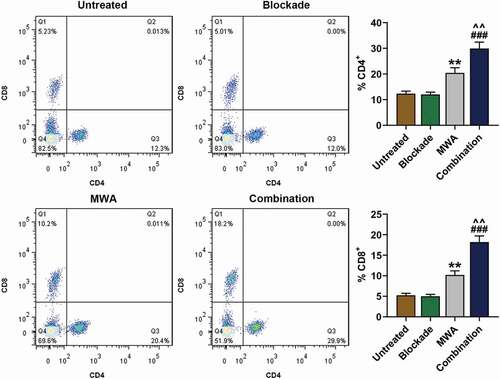
Figure 4. MWA with anti-PD-1/anti-CTLA-4 induced specific antitumor immunity synergistically. A: Representative enzyme-linked immunospot pictures from Untreated group, Blockade group, MWA group and Combination group. Cells secreting IFN-(IFN-γ) in the spleens after Hepa1-6 cell implantation were analyzed by ELISPOT assay. ^^^P < 0.001, vs. MWA; ###P < 0.001, vs. Blockade. B: Representative ELISPOT pictures from Untreated group, Blockade group, MWA group and Combination group. Cells secreting IFN-γin the spleens after CT26 cell implantation were analyzed by enzyme-linked immunospot (ELISPOT) assay. Each experiment was independently conducted in triplicate
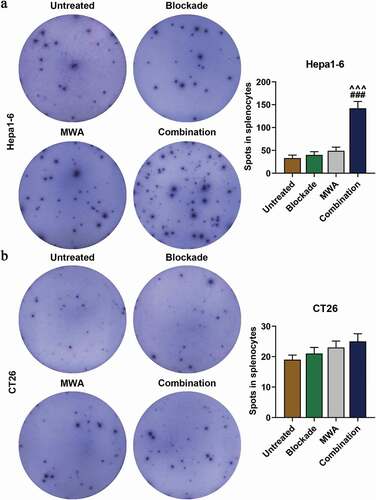
Figure 5. Treatment of MWA with anti-PD-1/anti-CTLA-4 caused Th1 cell polarization. The proportion of IFN-γ-producing Th1 cells and Th2 cells producing Interleukin-4 (IL-4) was quantified after flow cytometry analysis. The ratio of Th1/Th2 cells was then measured. ^^P < 0.01, ^^^P < 0.001, vs. MWA; ##P < 0.01, ###P < 0.001, vs. Blockade. Each experiment was independently conducted in triplicate
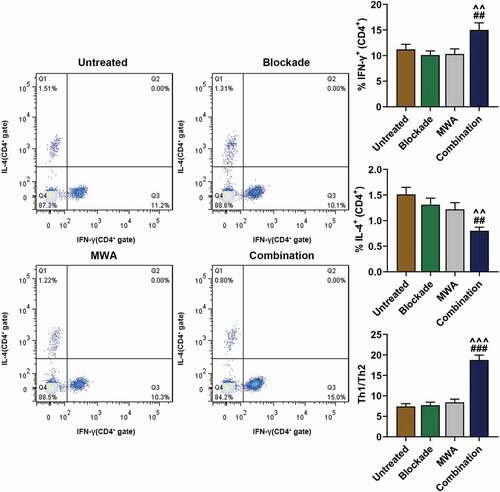
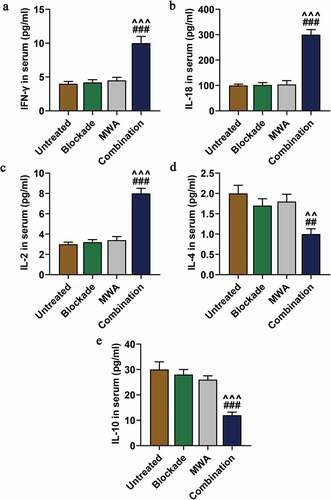
Figure 6. MWA combined with anti-PD-1/anti-CTLA-4 increased Th1-type cytokines but reduced Th2-type cytokines. A: Serum concentrations of Th1-type cytokine IFN-γ in the mice of Untreated group, Blockade group, MWA group and Combination group were measured. ^^^P < 0.001, vs. MWA; ###P < 0.001, vs. Blockade. B: Serum concentrations of Th1-type cytokine IL-18 in mice of Untreated group, Blockade group, MWA group and Combination group were measured. ^^^P < 0.001, vs. MWA; ###P < 0.001, vs. Blockade. C: Concentrations of Th1-type cytokine IL-2 in mice serum of Untreated group, Blockade group, MWA group and Combination group were measured. ^^^P < 0.001, vs. MWA; ###P < 0.001, vs. Blockade. D: Serum concentrations OF Th2-type cytokine IL-4 in mice of Untreated group, Blockade group, MWA group and Combination group were measured. ^^P < 0.01, vs. MWA; ##P < 0.01, vs. Blockade. E: Serum concentrations of Th2-type cytokine IL-10 in mice of Untreated group, Blockade group, MWA group and Combination group were measured. n = 5. ^^^P < 0.001, vs. MWA; ###P < 0.001, vs. Blockade. Each experiment was independently conducted in triplicate