
Figures & data
Figure 1. miR-1275 was upregulated in hESC-derived cardiomyocytes and H9C2 cardiomyocytes after treated by OGD/R. (a) The expression of specific cardiomyocyte markers (GATA4, TNNT2, and MYL7) and hESC-specific markers (Oct-4 and Sox-2) in hESC-derived cardiomyocytes was examined by western blotting. (b) Representative image of hESC-derived cardiomyocytes. (c and d) LDH activity of hESC-derived cardiomyocytes and H9C2 cardiomyocytes was measured after treated by oxygen-glucose deprivation (OGD) followed by reperfusion for 3 h, 6 h, 12 h, 24 h. (e and f) The expression of miR-1275 in cardiomyocytes was measured through RT-qPCR after stimulation by OGD/R treatment. Values are expressed as mean ± SEM, n = 3, *P < 0.05, **P < 0.01, compared with the untreated group. #P < 0.05, compared with the OGD + reperfusion for 3 h treatment group
Figure 2. Knockdown of miR-1275 inhibited cell apoptosis and cell injury in cardiomyocytes with OGD/R treatment. (a) Transfection efficiency of miR-1275 antagomirs in hESC-derived cardiomyocytes was examined. miR-1275 antagomirs (40 nM, anta-miR) or negative control antagomir (40 nM, anta-NC) were transfected into hESC-derived cardiomyocytes and cultured for 48 h. *P < 0.05, **P < 0.01, compared with negative control group. (b) The expression of miR-1275 in OGD/R-stimulated cardiomyocytes was measured after transfected with miR-1275 antagomir1 (anta-miR). (c, d) LDH and CK activity in OGD/R-stimulated cardiomyocytes were analyzed by ELISA Kits. (e, f) Cell apoptosis was detected through the Annexin V-FITC/PI double staining kit. (g) The expression of apoptosis-related proteins was detected through Western blotting. (h-j) ROS levels (h), Intracellular Ca2+ concentration (i) and SR Ca2+ leak (j) in cardiomyocytes were tested. Values are expressed as mean ± SEM, n = 3, *P < 0.05, **P < 0.01, compared with untreated group; #P < 0.05, compared with OGD/R + anta-NC treated group
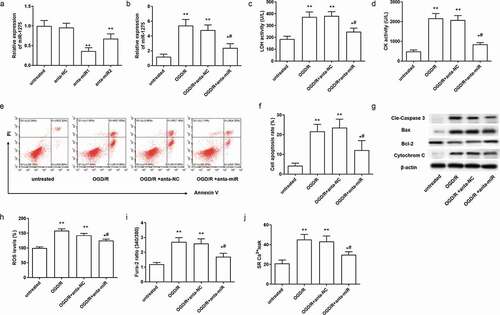
Figure 3. NMUR1 is a predicted target of miR-1275 and it is negatively regulated by miR-1275. (a) The miR-1275 seed sequences and the predicted binding sites of NMUR1 3ʹ-UTR mutation sites are highlighted in red. (b) Transfection efficiency of miR-1275 mimics in hESC-derived cardiomyocytes was examined. Negative control mimics (30 nM, mimic-NC) and miR-1275 mimics (30 nM, miR mimic) were transfected into hESC-derived cardiomyocytes and incubated for 48 h. (c) Luciferase activity of NMUR1 was tested. **P < 0.01, compared with NC mimic transfection group. (d) The expression of NMUR1 mRNA was examined. Values are expressed as mean ± SEM, n = 3, **P < 0.01, compared with untreated group. #P < 0.05, compared with mimic-NC transfected group; &P < 0.05, compared with anta-NC transfected group
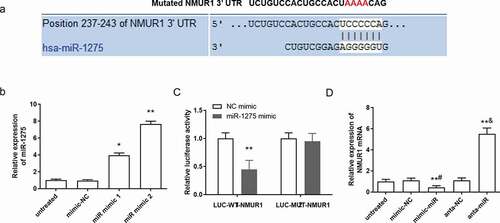
Figure 4. Silence of NMUR1 reversed the effect of miR-1275 knockdown on cell injury in myocardial cell. (a, b) The expression of NMUR1 mRNA and proteins in cardiomyocytes was measured after transfection with si-NMUR1 (50 nM). **P < 0.01, compared with si-NC transfected group. (c–h) NMUR1 expression (c), LDH (e) and CK (f) activity, ROS levels (F) and cell apoptosis (g, h) in cardiomyocytes were detected after transfection with the miR-1275 antagomir, si-NMUR1 or co-transfection with the miR-1275 antagomir and si-NMUR1. Values are expressed as mean ± SEM, n = 3, *P < 0.05, **P < 0.01, compared with untreated group. #P < 0.05, compared with OGD/R-treated group; &P < 0.05, compared with OGD/R + anta-miR transfected group
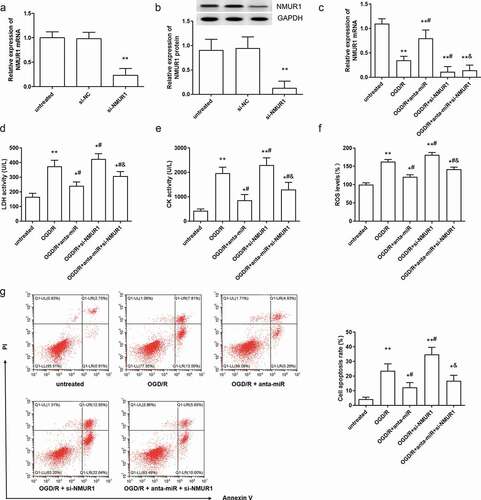
Figure 5. Silence of NMUR1 partly suppressed the inhibitory effect of miR-1275 knockdown on calcium overload in OGD/R in hESC-derived cardiomyocytes. (a, b). Intracellular Ca2+ concentration and SR Ca2+ leak in cardiomyocytes were examined. (c, d). The expressions of NMUR1, NCX1, RyR2, SERCA2a, PS16 PLN, and total-PLN (t-PLN) were examined by Western blot analysis. Values are expressed as mean ± SEM, n = 3, *P < 0.05, **P < 0.01, compared with untreated group. #P < 0.05, compared with OGD/R-treated group; &P < 0.05, compared with OGD/R + anta-miR transfected group
Supplemental Material
Download MS Word (536.6 KB)Data availability
The data used to support the findings of this study are included within the article.