
Figures & data
Figure 1. Identification of BMSCs-EVs. (a), representative image of primary BMSCs (× 200); (b,c), Oil red staining and Alizarin red staining were performed to validate the lipogenesis and osteogenic differentiation ability of BMSCs (× 200); (d), BMSCs surface markers (CD44, CD54, CD34 and CD90) were detected by flow cytometry; (e), transmission electron microscope of EVs at 5000 demonstrating homogenous, cup‐shaped vesicles with size in 80 nm. Scale bar represents 200 nm in both panels; (f), Nanoparticle tracking analysis of BMSCs-EVs; (g), western blot analysis assessed expression of EV markers in BMSCs
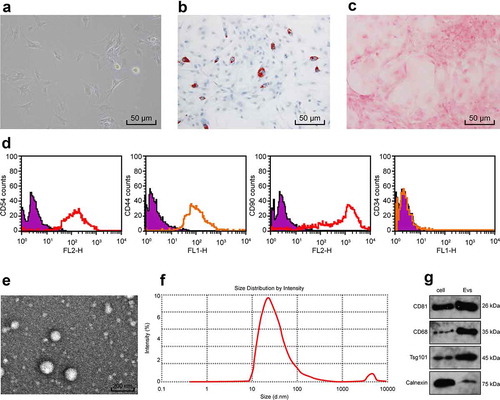
Figure 2. BMSCs-EVs promote the repair of IDD in mice. (a), HE staining was performed to represent for intervertebral disc pathology observation (× 200);(b–d), immunohistochemical staining to evaluate the positive expression of MMP-2 (b), MMP-6 (c) and TIMP1 (d) in the nucleus pulposus of the intervertebral disc of mice in each group; E, TUNEL staining were performed to measure apoptosis index of the intervertebral disc (× 200). Three independent experiments were performed, and each group contained at least 8 mice. Data are expressed as mean ± s.d. One-way ANOVA and Tukey’s multiple comparisons test were used to determine statistical significance. **p < 0.01
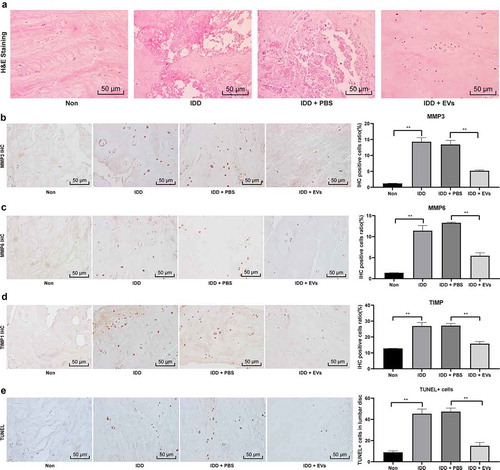
Figure 3. BMSCs-EVs promote proliferation of NPCs and inhibit apoptosis. (a), representative image of primary NPCs (× 200); (b), representative image of safranine O staining (× 200); (c), representative image of toluidine blue staining (× 200); (d), immunofluorescence of col II and Aggrecan represented for typical NPCs marker (× 200); (e), fluorescence microscopy showing the uptake of EVs labeled with the red fluorescent dye PKH26 (× 200); (f,g), Immunofluorescence of col II and Aggrecan (× 200); H, SA-βgal staining was utilized for NPC senescence measurement; and blue represented senescent cells; (i), TUNEL staining were performed to measure apoptosis index; green indicates TUNEL-positive cells, blue indicates nucleus (× 200). Three independent experiments were performed. Data are expressed as mean ± s.d. One-way ANOVA and Tukey’s multiple comparisons test were used to determine statistical significance. **p < 0.05
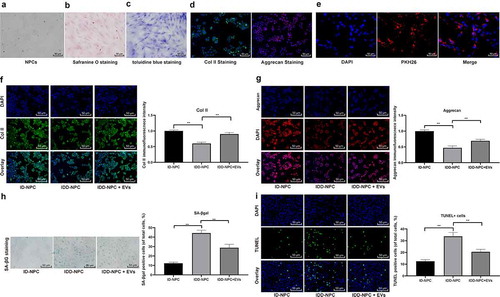
Figure 4. BMSCs-EVs promote miR-199a expression in intervertebral disc. (a), microarray was performed to determine dysregulated miRs after EV treatment; (b), intervertebral disc miR-199a expression was measured by RT-qPCR after EV treatment. (c) RT-qPCR analysis of the expression of miR-199a in miR-199a inhibitor-transfected-BMSCs, BMSCs-EVs and BMSCs-EVs-treated NPCs. (d) BMSCs were treated with RNase A or RNase A in combination with Triton X-100. RT-qPCR analysis of the expression of miR-199a. Three independent experiments were performed, and each group contained at least 8 mice.). Data are expressed as mean ± s.d. One-way ANOVA and Tukey’s multiple comparisons test were used to determine statistical significance. **p < 0.01
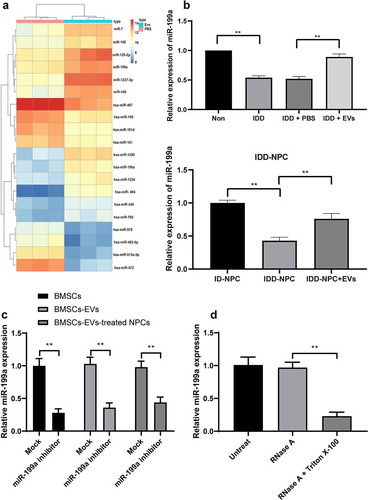
Figure 5. Reduction of miR-199a in BMSCs-EVs weakens the protection of EVs on mouse NPCs. A/B, Immunofluorescence of col II and Aggrecan (×200); C, SA-βgal staining was utilized for NPC senescence measurement (×200); D: PI/Annexin labeled cells were performed to measure apoptosis index by flow cytometry. Three independent experiments were performed. Data are expressed as mean ± s.d. One-way ANOVA and Tukey’s multiple comparisons test were used to determine statistical significance
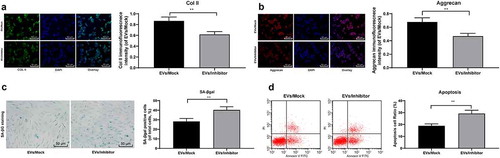
Figure 6. miR-199a targets GREM1 to downregulate the TGF-β pathway. (a), clustering analysis was performed using the limma Rstudio based on GSE34095 using FC ≥2.0 and P < 0.05 for mRNA different analysis; (b), 36 dysregulated mRNAs, miR-199a target mRNAs predicted by Starbase and TargetScan took intersection and GREM1 was filtered; (c), TargetScan predicts GREM1 target miRNAs and validated by dual luciferase assays; (d), PPI (protein – protein interaction) analysis by STRING; (e), clustering analysis was performed using the limma Rstudio based on GSE37075 using FC ≥2.0 and P < 0.05 for KEGG pathway; (f), ELISA were performed to determine TGF-β, Smad1, pSmad1, Smad3 and pSmad3 protein content. Three independent experiments were performed. Data are expressed as mean ± s.d. Two-way ANOVA and Tukey’s multiple comparisons test were used to determine statistical significance
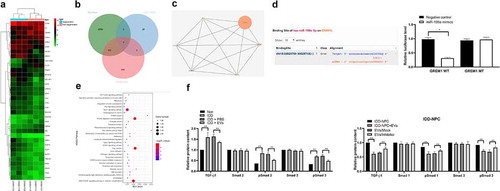
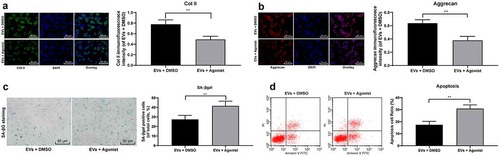
Figure 7. TGF-β agonist counteracts the protective effect of EVs on NPCs. (a,b), Immunofluorescence of col II and Aggrecan (×200); (c), SA-βgal staining was utilized for NPC senescence measurement (×200); (d), PI/Annexin labeled cells were performed to measure apoptosis index by flow cytometry. Three independent experiments were performed. Data are expressed as mean ± s.d. One-way ANOVA and Tukey’s multiple comparisons test were used to determine statistical significance
Data accessibility statement
All the data generated or analyzed during this study are included in this published article.