Figures & data
Table 1. Correlation between circ-FOXM1 expression and the clinicopathologic features of NSCLC patients
Figure 1. The level of circ-FOXM1 in NSCLC tissues and cells. (a) The level of circ-FOXM1 was detected by RT-qPCR in NSCLC tissues and adjacent normal tissues; Student’s t-test was performed for statistical analysis. (b) Circ-FOXM1 expression was examined in tissues isolated from various TNM stage (I+ II, III+IV) NSCLC patients by RT-qPCR; Student’s t-test was performed for statistical analysis. (c) The level of circ-FOXM1 was determined in NSCLC cells and normal cells; ANOVA followed via Tukey’s test was performed for statistical analysis. (d) Random hexamer or oligo (dT) primers were used to measure the levels of circ-FOXM1 and mRNA-FOXM1; Student’s t-test was performed for statistical analysis. (e and f) The levels of circ-FOXM1 and mRNA-FOXM1 were examined in NSCLC cells after the treatment of RNase R; Student’s t-test was performed for statistical analysis. *P < 0.05
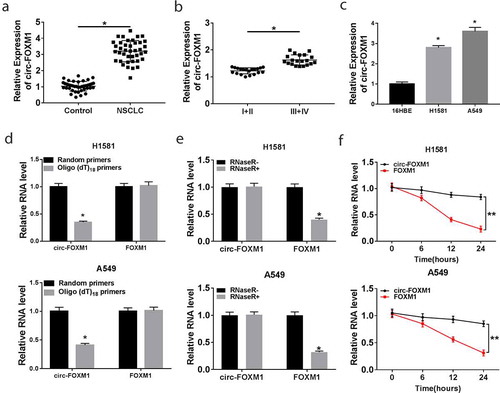
Figure 2. The function of circ-FOXM1 in NSCLC cells and tumor growth in vivo. (a-i) H1581 and A549 cells were transfected with sh-NC or sh-circ-FOXM1. (a) Circ-FOXM1 expression was determined by RT-qPCR. (b) CCK-8 was used to assess cell viability. (c) Flow cytometry was employed to analyze cell apoptosis rate. (d) The protein expression of cleaved-caspase-3 and cleaved PARP was detected by western blot. (e) Western blot assay was performed to detect the levels of LC3-I, LC3-II, and P62. (f) Cell migratory ability was measured by transwell assay. (g and h) Tumor volume and weight were calculated in sh-NC mice and sh-circ-FOXM1 mice. There were six mice in each group. (i) The mice body weight was calculated. Student’s t-test was performed for statistical analysis. *P < 0.05
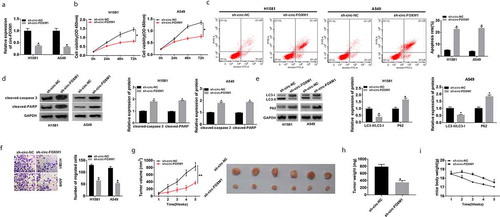
Figure 3. The interaction between circ-FOXM1 and miR-149-5p. (a) The interaction between circ-FOXM1 and miR-149-5p was predicted by starbase3.0. (b) Relative luciferase activity of H1581 and A549 cells co-transfected with circ-FOXM1 WT or circ-FOXM1 MUT and miR-149-5p or miR-NC was measured; ANOVA followed via Tukey’s test was performed for statistical analysis. (c) Pull-down assay was carried out to confirm the interaction between circ-FOXM1 and miR-149-5p; Student’s t-test was performed for statistical analysis. (d) The level of miR-149-5p was detected in NSCLC and normal tissues by RT-qPCR; Student’s t-test was performed for statistical analysis. (e) The level of miR-149-5p was detected in NSCLC cells and normal cells by RT-qPCR; ANOVA followed via Tukey’s test was performed for statistical analysis. (f) The relationship between circ-FOXM1 expression and miR-149-5p expression was analyzed in NSCLC tissues by Pearson correlation coefficient. (g) Circ-FOXM1 expression was examined in H1581 and A549 cells transfected with Vector or circ-FOXM1; Student’s t-test was performed for statistical analysis. (h) MiR-149-5p expression was determined in H1581 and A549 cells transfected with sh-NC, sh-FOXM, Vector, or circ-FOXM1, respectively; ANOVA followed via Tukey’s test was performed for statistical analysis. *P < 0.05
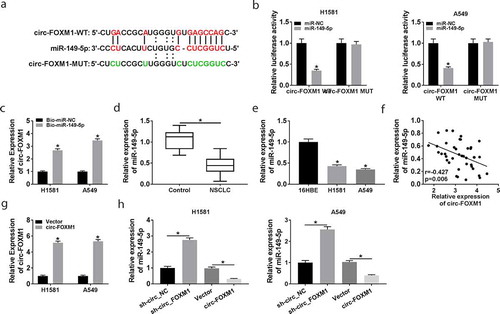
Figure 4. The role of miR-149-5p in circ-FOXM1-regulated NSCLC progression. (a) MiR-149-5p expression was detected in H1581 and A549 cells transfected with miR-NC or miR-149-5p; Student’s t-test was performed for statistical analysis. (b-g) H1581 and A549 cells were transfected with miR-NC, miR-149-5p, miR-149-5p + Vector, or miR-149-5p + circ-FOXM1. (b) Cell viability was assessed by CCK-8; ANOVA followed via Tukey’s test was performed for statistical analysis. (c) Cell apoptosis was analyzed using flow cytometry; ANOVA followed via Tukey’s test was performed for statistical analysis. (d) Transwell assay was employed to measure cell migratory ability; ANOVA followed via Tukey’s test was performed for statistical analysis. (e) The relative level of cleaved-caspase-3 and cleaved-PARP was detected; ANOVA followed via Tukey’s test was performed for statistical analysis. (f and g) The levels of LC3-I, LC3-II, and P62 were investigated by western blot assay; ANOVA followed via Tukey’s test was performed for statistical analysis. *P < 0.05
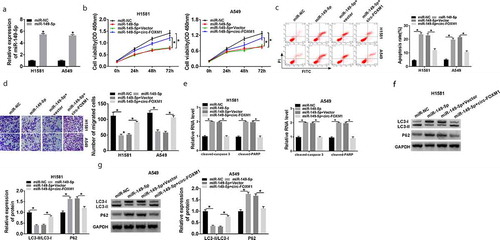
Figure 5. The interaction between miR-149-5p and ATG5. (a) The interaction between miR-149-5p and ATG5 was predicted by starbase3.0. (b) Relative luciferase activity was determined in H1581 and A549 cells transfected with ATG5-WT or ATG5-MUT and miR-149-5p or miR-NC; ANOVA followed via Tukey’s test was performed for statistical analysis. (c) RNA pull-down assay was carried out to verify the interaction between ATG5 and miR-149-5p; Student’s t-test was performed for statistical analysis. (d and e) The mRNA and protein level of ATG5 were detected by RT-qPCR and western blot in NSCLC and normal tissues; Student’s t-test was performed for statistical analysis. (e) The protein expression of ATG5 in NSCLC cells and normal cells was measured by western blot; ANOVA followed via Tukey’s test was performed for statistical analysis. (f) MiR-149-5p expression was determined in H1581 and A549 cells transfected with Anti-miR-NC or Anti-miR-149-5p; Student’s t-test was performed for statistical analysis. (g) ATG5 expression was analyzed in H1581 and A549 cells transfected with miR-NC, miR-149-5p, Anti-miR-NC, or Anti-miR-149-5p, respectively; ANOVA followed via Tukey’s test was performed for statistical analysis. *P < 0.05
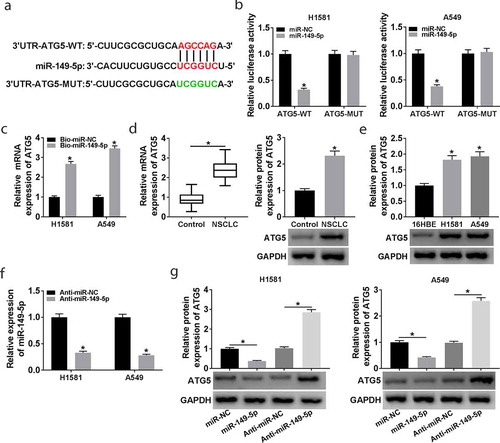
Figure 6. The role of ATG5 in miR-149-5p-regulated NSCLC cell progression. (a-e) H1581 and A549 cells were transfected with sh-NC, sh-ATG5, sh-ATG5 + Anti-miR-NC, or sh-ATG5 + Anti-miR-149-5p. (a) Cell viability was measured by CCK-8 assay. (b) Flow cytometry was used to analyze cell apoptosis rate. (c) Transwell assay was employed to determine cell migration. (d) The relative level of cleaved-caspase-3 and cleaved-PARP was determined. (e) Western blot assay was carried out to detect the levels of LC3-I, LC3-II, and P62. ANOVA followed via Tukey’s test was performed for statistical analysis. *P < 0.05
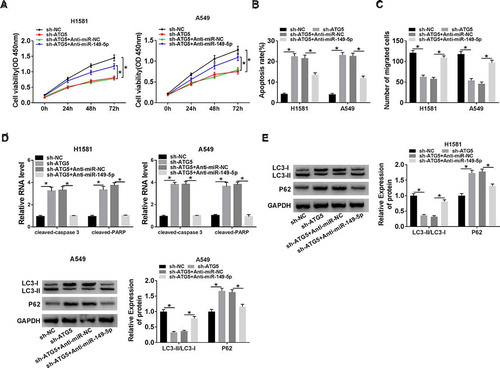
Figure 7. The relationship among circ-FOXM1, miR-149-5p, and ATG5. (a and b) The expression of ATG5 was determined in H1581 cells transfected with sh-circ-NC, sh-circ-FOXM1, sh-circ-FOXM1 + Anti-miR-NC, or sh-circ-FOXM1 + Anti-miR-149-5p, respectively; ANOVA followed via Tukey’s test was performed for statistical analysis. (c and d) The expression of ATG5 was detected in A549 cells transfected with Vector, circ-FOXM1, circ-FOXM1 + miR-NC, or circ-FOXM1 + miR-149-5p, respectively; ANOVA followed via Tukey’s test was performed for statistical analysis. *P < 0.05