Figures & data
Figure 1. MIAT expression in a microarray for the whole genome RNA of knee joint synovium from different grades of inflammation in collagen-induced arthritis (CIA) (GSE13071). A. Heat map of MIAT expression. The color from green to red means the change of MIAT expression from low expression to high expression. B. The curve of MIAT expression. All 15 samples in GSE13071 were divided into five groups (GSM327381-83: the healthy control; GSM327384-96: no joint inflammation; GSM327387-89: mild joint inflammation; GSM327390-92:moderate joint inflammation; GSM327393-95: severe joint inflammation). Each sample represents an individual mouse (n = 15)
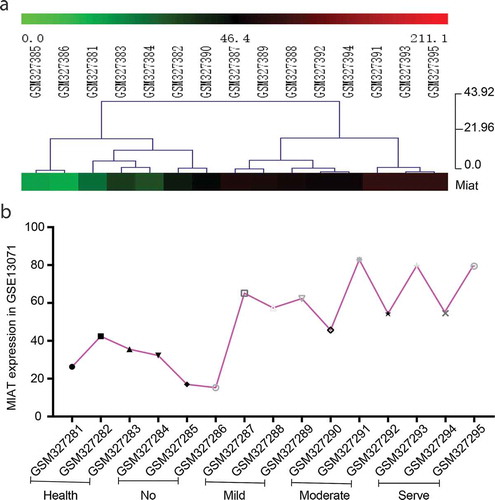
Figure 2. Assessments of CIA and the number of macrophages in knee joint synovium and myocardial tissues of CIA. A. The disease scores of CIA mice (n = 7) and the healthy control (n = 5). From day28, the redness and swallow of paw, knee or ankles in CIA mice appeared. B. C. IL-1β, TNF-ɑ levels in serum of CIA mice (n = 7) and the healthy control (n = 5). D. E. HE staining for inflammatory infiltration in knee joint synovium and myocardial tissue of CIA (n = 7) and of the healthy control (n = 5) (including microscopes of 100× and 400×) in the last day. F. The number of macrophages of synovium and myocardial tissues in CIA mice (n = 7) and the healthy control (n = 5) under the microscopes of 400 × . At least 5 different regions were observed in each slice, and the cell count of macrophages in every region was performed by 3 people at the same time. One‐way analysis of variance (ANOVA) was used for statistical analysis among groups. Student’s t test was performed for two-group samples, *P < 0.05, **P < 0.01
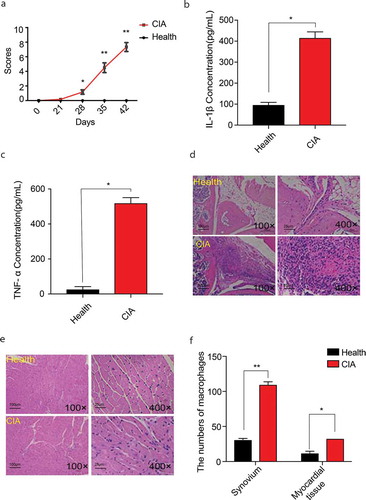
Figure 3. MIAT relative expression in tissues of CIA and in inflammation models of J774A.1. A. MIAT relative expression in knee joint synovium and myocardial tissue of CIA (n = 7) and of the healthy control (n = 5). B. C. IL-1β, TNF-ɑ levels in cell supernatant of J774A.1 with PBS and LPS. D. MIAT relative expression of J774A.1 with PBS and LPS. Data of cells are collected from three independent experiments. One‐way analysis of variance (ANOVA) was used for statistical analysis among groups. Student’s t test was performed for two-group samples, *P < 0.05
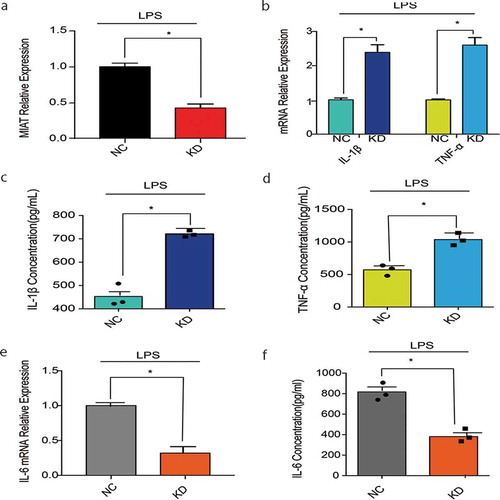
Figure 4. Cytokines in J774A.1 with MIAT-knocking down. A. MIAT relative expression with LPS stimuli in the negative control and MIAT-knocking down group. B. IL-1β, TNF-ɑ mRNA relative expression with LPS stimuli in the negative control and MIAT-knocking down group. C. D. IL-1β, TNF-ɑ levels in cell supernatant of J774A.1 with LPS stimuli in the negative control and MIAT-knocking down group. E. IL-6 mRNA relative expression with LPS stimuli in the negative control and MIAT-knocking down group. F. IL-6 levels in cell supernatant of J774A.1 with LPS stimuli in the negative control and MIAT-knocking down group. Data of cells are collected from three independent experiments. ANOVA was used for statistical analysis among groups. Student’s t test was performed for two-group samples, *P < 0.05
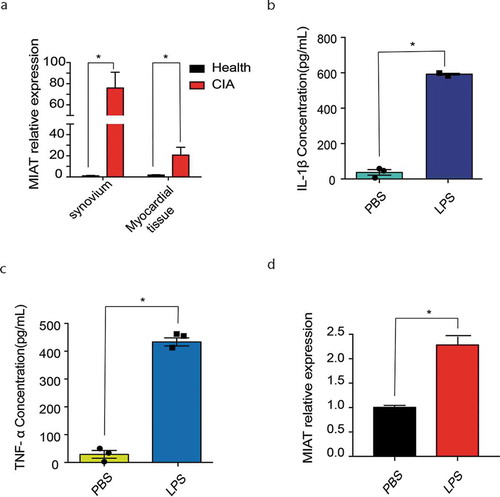
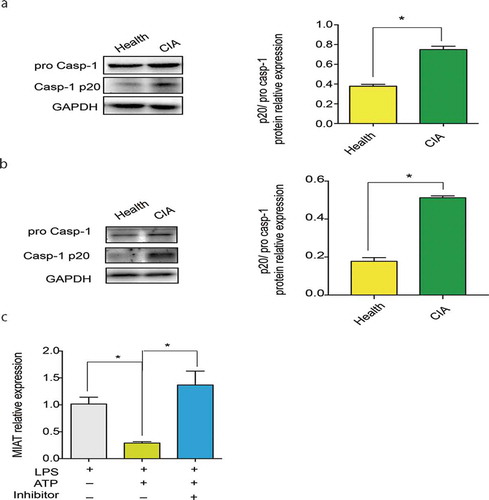
Figure 5. NLRP3 inflammasome activation in CIA. A. Activated caspase-1 expression in synovium of CIA (n = 7) and the healthy group (n = 5). Image J was used to analyze the western blotting pictures by gray value and p20/pro casp-1 ratio was used to define caspase-1 activation. B. Activated caspase-1 expression in myocardial tissues of CIA (n = 7) and the healthy group (n = 5). C. MIAT relative expression in LPS, LPS/ATP and LPS/ATP +Inhibitor group of J774A.1.Data of cells are collected from three independent experiments. ANOVA was used for statistical analysis among groups. Student’s t test was performed for two-group samples, *P < 0.05