Figures & data
Figure 1. Expression and localization of WHAMM during mouse oocyte maturation. (a) Subcellular localization of WHAMM during mouse oocyte maturation. Immunostaining was performed using an anti-WHAMM antibody. WHAMM was detected near the chromosomes in the GV and GVBD stages, or around the spindle after the MI stage. (b) Immunostaining of WHAMM fixed with methanol. After fixation, immunostaining was performed as described in (A). (a and b) Blue, DNA; green, WHAMM; white; DIC. Scale bar: 20 μm. (c) Co-staining of WHAMM and cytoplasmic actin mesh. WHAMM localizes in the spindle actin region. Blue, DNA; red, F-actin; green, WHAMM. Scale bar: 20 μm. (d) Co-staining of WHAMM and alpha-tubulin. WHAMM is localized around the meiotic spindle. Blue, DNA; green, Tubulin; red, WHAMM. Scale bar: white, 20 μm; yellow, 4 μm. (e) Quantification of WHAMM intensity in Negative and WHAMM dsRNA-injected oocytes after 8 h meiotic resumption. WHAMM protein level in yellow circle was measured using a confocal microscope and by staining with anti-WHAMM antibody and was normalized using relative intensity in WHAMM dsRNA-injected groups against of Negative control. ***P < 0.001. Experimental replication was performed 3times (N = 3). n values are as indicated
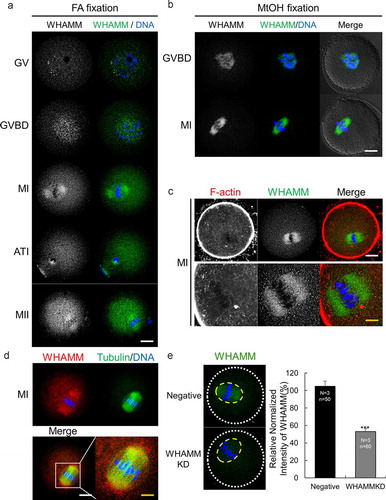
Figure 2. WHAMM is essential for asymmetric division and formation of spindle actin in maturing mouse oocytes. (a) Maturation status of oocytes injected with dsRNA against WHAMM, or that for the negative control. Impairment of asymmetric division by knockdown of WHAMM. Arrows indicate the extrusion of large polar bodies. Scale bar: 50 μm. (b) Maturation ratio 12 h after meiotic resumption was examined. Oocytes yielding a large polar body are also considered as MII. ***P < 0.001. (c) WHAMM knockdown increases the polar body (Manseau and Schupbach) size. The ratio of the diameter of the polar body to that of the oocyte in control and WHAMM-knockdown oocytes is shown. ***P < 0.001. (D, E, and F) Phalloidin-stained cytoplasmic actin mesh in oocytes injected with negative control dsRNA (Negative) and WHAMM-specific dsRNA (WHAMM KD). Oocytes were sampled at the GV, early MI, MI, late MI, or ATI stages (0, 5, 6, 8, and 9.5 h, respectively, after meiotic resumption) under the same conditions. Knockdown of WHAMM impairs the formation of complete spindle actin. The arrow indicates misaligned chromosomes by disruption of spindle actin. Blue, DNA; red F-actin. Scale bar: 7 μm. (e) Spindle actin intensity was represented percent (%) of intensity relative to mean of control. The number of oocytes used to analysis in control and WHAMM KD was 10, 11, respectively. ***P < 0.001. (f and g) The knockdown of WHAMM impairs the formation of spindle actin but does not affect cytoplasmic actin mesh. (g) Quantification of phalloidin fluorescence intensity of cytoplasmic actin at 8 h (MI) after meiosis resumption in oocytes injected with dsRNA. Fluorescence intensities of each oocyte were normalized to the mean intensity of control oocytes and presented as percent (%) of intensity relative to mean of control. Boxes show the interquartile range; whiskers show 1.5× the interquartile range; the line represents the median. N.S.: not statistically significant (P > 0.05)
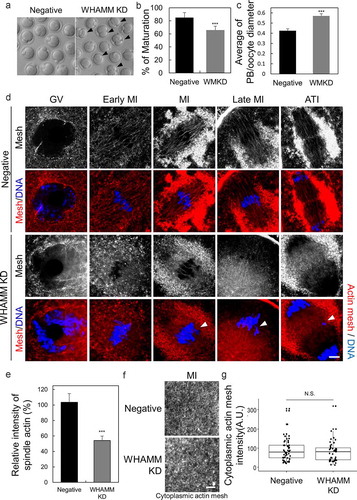
Figure 3. Knockdown of WHAMM impairs formation of normal length spindle, localization of the MTOC, and chromosome alignment during early spindle formation. (a) Time-lapse microscopy of maturing control (Negative) and WHAMM-knockdown oocytes. Spindles or chromatin were visualized upon injection of Complementary RNA (cRNA) encoding alpha-tubulin-GFP (green) or H2B-mCherry (Schmitt and Nebreda), respectively. The length of the spindles 5 h after meiotic resumption is marked with a white line. Scale bar: 10 μm. (b) The length of the spindle was determined by quantifying the distance between the two spindle poles in control and WHAMM KD oocytes. n values are indicated. Boxes show interquartile range; whiskers show 1.5x the interquartile range; the line represents the median. ***P < 0.001. (c) WHAMM dsRNA and control dsRNA-injected oocytes were sampled at 3.5, 4, 4.5, 5.5, and 6 h after meiotic resumption. Co-staining of the MTOC using the anti-pericentrin antibody, meiotic spindles, and chromosomes is represented. Localization of pericentrin was impaired and failed to accumulate at spindle poles in WHAMM KD oocytes, as indicated by the arrow. Defective spindle morphology and chromosome alignment in WHAMM KD oocytes are shown. Blue, DNA; red, pericentrin; green, alpha-tubulin. Scale bar: 10 μm. (d) Relative area of MTOC at MI stage oocytes injected by WHAMM dsRNA or control dsRNA. MTOC was stained by the anti-pericentrin antibody. The area of pericentrin was increased in WHAMM KD oocytes than that of the negative control group, as indicated by the arrow. Boxes show interquartile range; whiskers show 1.5x the interquartile range; the line represents the median. ***P < 0.001
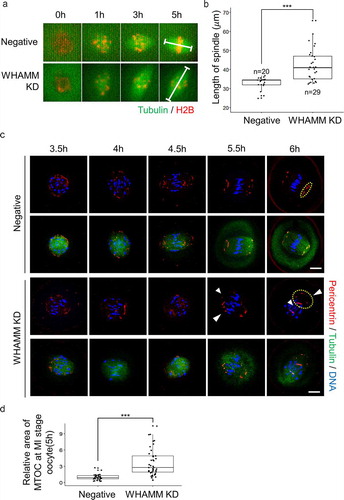
Figure 4. Depletion of WHAMM disrupts chromosome alignment of MI stage oocytes and increases aneuploidy at MII stage oocytes. (a) Chromosome spread of negative and WHAMM-specific dsRNAs-injected oocytes fixed at the MI stage. Blue, DNA. (b) Percentage of distance between the chromosomes in negative and WHAMM knockdown MI oocytes. The chromosomal misalignment of WHAMM was increased in WHAMM KD oocytes. (c) Chromosome spreads of MII stage oocytes and immunostained by anti-ACA antibody for detecting the kinetochore. Pink, ACA; Blue, DNA. (d) Percentage of aneuploidy (including the extra and missing chromosome) of WHAMM KD or negative control at MII stage oocytes. n values are indicated. ***P < 0.001
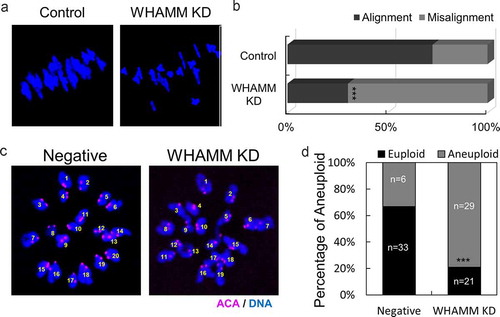
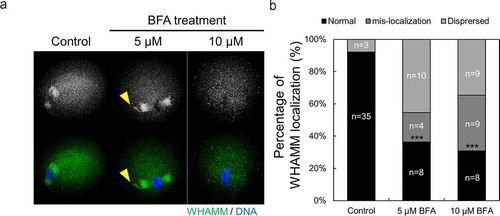
Figure 5. Localization of WHAMM is affected by ER to Golgi apparatus transport. (a and b) Representative images were stained for DNA (blue), cortical actin (Schmitt and Nebreda), and WHAMM (green), showing dispersed localization of WHAMM in control and 50 or 100 μM BFA-treated oocytes. Oocytes were fixed 8 h after meiotic resumption and then immunostained. BFA treatment caused abnormal WHAMM localization and failed accumulation of WHAMM near the chromosome. Scale bar: 20 μm. (c) Abnormal localization of WHAMM increased in BFA-treated oocytes compared to the control group. n values are indicated. ***P < 0.001