Figures & data
Figure 1. HOXC-AS2 is upregulated in NSCLC tissues. (a) Heat map of the dysregulated expression of the top 10 lncRNAs. (AB) The expression of HOXC-AS2 in human NSCLC tissues (n = 20) and normal tissues (n = 10) was compared by RT-qPCR analysis. (B, C, D, and EC, D, E, and F) HOXC-AS2 mRNA expression in A549 and HCC827 cell lines were detected by RT-qPCR analysis. *P < 0.05 (vs normal tissues/si-NC/NC-Vector), **P < 0.01 (vs NC-Vector). Data were represented as means ± standard deviation (SD). Each experiment was performed in triplicate
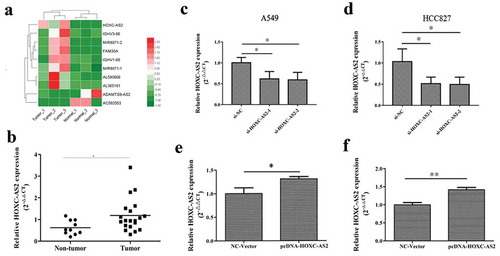
Figure 2. HOXC-AS2 regulates NSCLC cell proliferation, apoptosis, and migration. (a and b) The proliferation of A549 and HCC827 cells were evaluated by CCK-8 and clone formation assay. (c) The apoptosis of A549 and HCC827 cells was assessed by Annexin V FITC/PI staining flow cytometry. (d) The migration ability of SW480 and HT29 cells were evaluated by transwell assay. (e) The β-catenin, α-SMA, MMP-1, MMP-2, and E-cadherin expression in A549 and HCC827 cells was determined by Western blot analysis. β-actin is a loading control. *P < 0.05 (vs si-NC/NC-Vector), **P < 0.01 (vs si-NC/NC-Vector), ***P < 0.001 (vs si-NC/NC-Vector). Data were represented as means ± standard deviation (SD). Each experiment was performed in triplicate
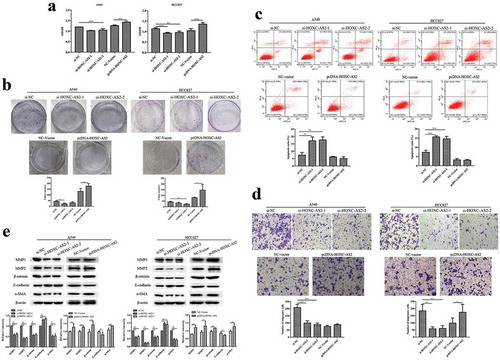
Figure 3. HOXC13 is a target gene of HOXC-AS2. (a) The predicted target genes of the dysregulated 10 lncRNAs. The dysregulated lncRNAs were as the center marked with red and the predicted target genes were marked with yellow. (AB) The expression of HOXC13 in human NSCLC tissues (n = 20) and normal tissues (n = 10) was compared by RT-qPCR analysis. (BC) RNA immunoprecipitation (RIP) assay was performed to recover the interaction of HOXC13 and HOXC-AS2. ***P < 0.001 (vs IgG). (C, D, and ED-G) The expression of HOXC13 in A549 and HCC827 cells was tested by Western blot and RT-qPCR analysis. β-actin is a loading control. (FH) The expression of HOXC-AS2 in A549 and HCC827 cells were tested via RT-qPCR analysis. *P < 0.05 (vs normal tissues/si-NC/NC-Vector), **P < 0.01 (vs si-NC/NC-Vector), ##P < 0.01(vs pcDNA-HOXC-AS2+ si-NC). Data were represented as means ± standard deviation (SD). Each experiment was performed in triplicate
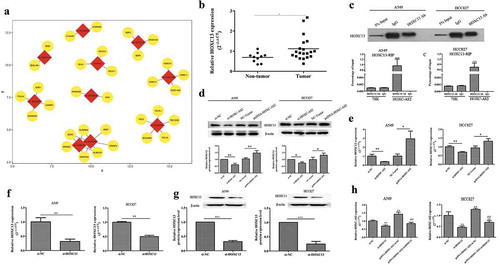
Figure 4. HOXC-AS2 regulates NSCLC cell proliferation, apoptosis, and migration via activation of HOXC13. (a and b) The proliferation of A549 and HCC827 cells were evaluated by CCK-8 and clone formation assay. (c) The apoptosis of A549 and HCC827 cells was assessed by Annexin V FITC/PI staining flow cytometry. (d) The migration ability of SW480 and HT29 cells were evaluated by transwell assay. (e) The β-catenin, α-SMA, MMP-1, MMP-2, and E-cadherin expression in A549 and HCC827 cells was determined by Western blot analysis. β-actin is a loading control. *P < 0.05 (vs si-NC), **P < 0.01 (vs si-NC), #P < 0.05(vs pcDNA-HOXC-AS2+ si-NC), ##P < 0.01(vs pcDNA-HOXC-AS2+ si-NC). Data were represented as means ± standard deviation (SD). Each experiment was performed in triplicate
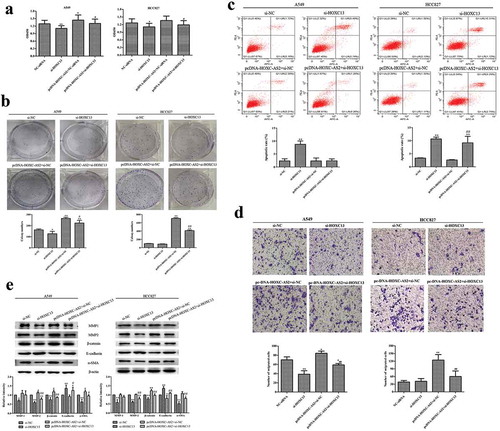
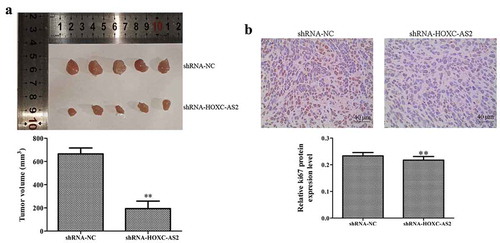
Figure 5. HOXC-AS2 silencing suppresses NSCLC development in vivo. (a) Compared with the shRNA-NC group, shRNA-HOXC-AS2 inhibited the tumor volume (bar = 10 mm). (b) The expression of Ki-67 was measured using immunohistochemistry (IHC) assay. *P < 0.05 (vs shRNA-NC), **P < 0.01 (vs shRNA-NC). Data were represented as means ± standard deviation (SD). Each experiment was performed in triplicate