Figures & data
Figure 1. The cytometry results of S. cerevisiae S288C under the three staining conditions including PI, the canonical Sybr Green I method, and the improved Sybr Green I method. (a-c). The dot plot, histogram, and automatic cell cycle statistics of S288C stained with PI. (d-f). The dot plot, histogram, and automatic cell cycle statistics of S288C stained via the canonical Sybr Green I method. (g-i). The dot plot, histogram, and automatic cell cycle statistics of S288C stained via the improved Sybr Green I method. (c,f,i). In the cell cycle statistics, the green color means the automatically analyzed G1 phase frequencies, and the blue color means the G2 phase ones, and the yellow color means the S phase ones
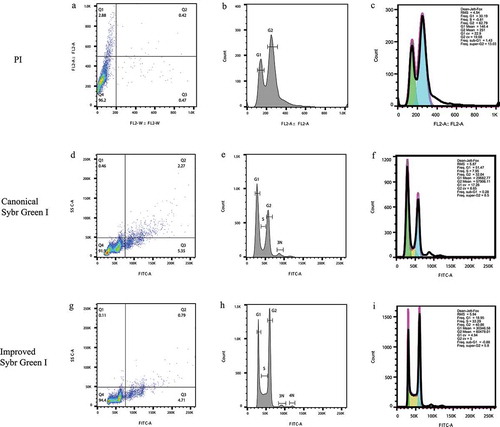
Figure 2. Flow cytometry results of C. neoformans H99 series strains stained with PI, the canonical Sybr Green I method, and the improved Sybr Green I method. (a-f). PI staining of the three strains. (g-l). Canonical Sybr Green I staining of the three strains. (m-u). Staining of the three strains via the improved Sybr Green I staining method. (a, b, g, h, m, n, o). Individual staining of H99 via the three staining methods. (c, d, i, j, p, q, r). Individual staining of H99 UBI1Δ via the three staining methods. (e, f, k, l, s, t, u). Individual staining of H99 UBI1Δ::UBI1 via the three staining methods. Due to the visibly low separations and high CV values of the peaks in the analyses, cell cycle statistics was not performed on the PI and canonical Sybr Green I staining assays but only on the improved Sybr Green I staining assays, which was more meaningful and applicable as compared with the two old methods. (o, r, u). In the cell cycle statistics, the green color means the automatically analyzed G1 phase frequencies, and the blue color means the G2 phase ones, and the yellow color means the S phase ones
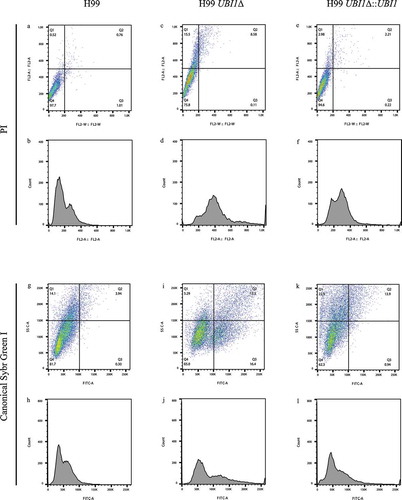
Figure 2. (Continued)
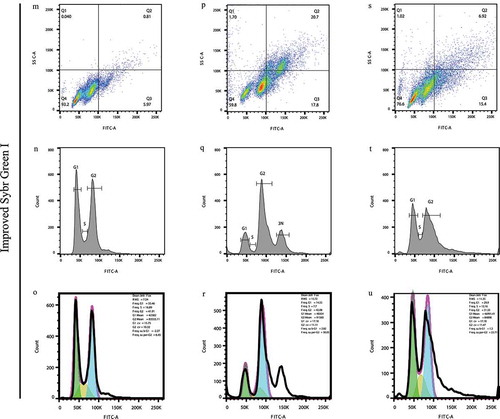
Figure 3. The additional manual cell cycle statistics performed on , including the statistical numbers to each phase