Figures & data
Table 1. The clinicopathological features of patients with osteosarcoma
Table 2. The primer sequences of genes used in qRT-PCR
Figure 1. HOTTIP is strongly expressed in the OS tissues and cells. (a) qRT-PCR analysis of the expression level of HOTTIP in the Osteosarcoma tissues (OST) and adjacent normal tissue (ANT). (b) The relative HOTTIP expression in the OS cells (Saos-2, MG63, U2OS, HOS) and the normal osteoblast hFOB1.19 cells. All data were represented by 3 independent experiments. *P < 0.05; **P < 0.01
Figure 2. Downregulation of HOTTIP induces apoptosis and inhibites proliferation, invasion and migration in OS cells. (a) qRT-PCR analysis of the HOTTIP expression level in U2OS and Saos-2 cells after HOTTIP silencing. (b) CCK-8 assay was used to evaluate the effect of HOTTIP knockdown on U2OS and Saos-2 cells viability. (c) Cell cycle of U2OS and Saos-2 cells treated with si-NC or si-HOTTIP was analyzed using flow cytometry analysis. (d) Colony formation assay analyzed the function of si-HOTTIP on cell colony formation capacity. (e) Cell apoptosis in OS cells was measured with Annexin V-PI staining followed by flow cytometry. (f) Invasion of OS cells was determined by transwell assay. (g) Wound healing assay was performed to assess the migratory capacity of U2OS and Saos-2 cells. All data were represented by 3 independent experiments. *P < 0.05; **P < 0.01; ***P < 0.001
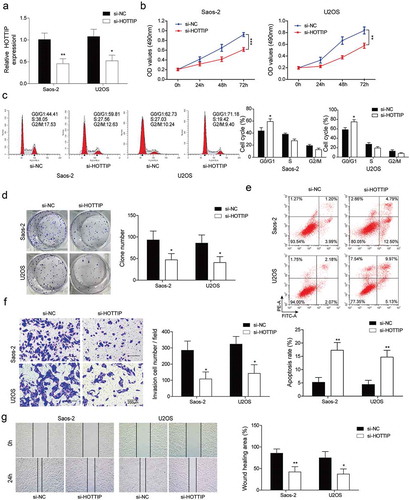
Figure 3. Overexpression of HOTTIP promotes proliferation, invasion and migration in OS cells. (a) qRT-PCR analysis of the HOTTIP expression level in U2OS and Saos-2 cells after HOTTIP overexpression. (b) CCK-8 assay was used to evaluate the effect of HOTTIP overexpression on U2OS and Saos-2 cells viability. (c) Flow cytometry was adopted to detect cell cycle of U2OS and Saos-2 cells after HOTTIP overexpression. (d) Colony formation assay was employed to test the influences of HOTTIP overexpression on cell proliferation. (e, f) Transwell and wound-healing assays were performed to test the invasive and migratory abilities of OS cells after HOTTIP overexpression. All data were represented by 3 independent experiments. *P < 0.05; **P < 0.01; ***P < 0.001
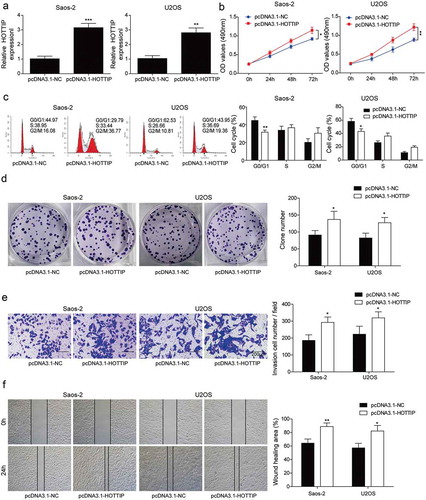
Figure 4. HOTTIP interacts with PTBP1 and increases its expression. (a) qRT-PCR detection of the percentage of HOTTIP, GAPDH and U1 in the cytoplasm and nuclear fractions of U2SO and Saos-2 cells. (b) RNA pull down analysis on the binding of HOTTIP to PTBP1. (c) RIP assay was used to detected the interaction of HOTTIP with PTBP1 in U2SO and Saos-2 cells. (d, e) The mRNA and protein levels of PTBP1 were detected by qRT-PCR and western blot in OS cells treated with pcDNA3.1-HOTTIP. All data were represented by 3 independent experiments. *P < 0.05; **P < 0.01; ***P < 0.001
Figure 5. PTBP1 restoration attenuates the effects of HOTTIP knockdown on proliferation, survival, migration, and invasion in OS cells. Saos-2 and U2OS cells co-transfected with siHOTTIP and pcDNA3.1-PTBP1 were subjected for (a) CCK-8 assay, (b) flow cytometry analysis, (c) colony formation assay, (d) transwell analysis and (e) wound-healing assay. All data were represented by 3 independent experiments. *P < 0.05; **P < 0.01; ***P < 0.001
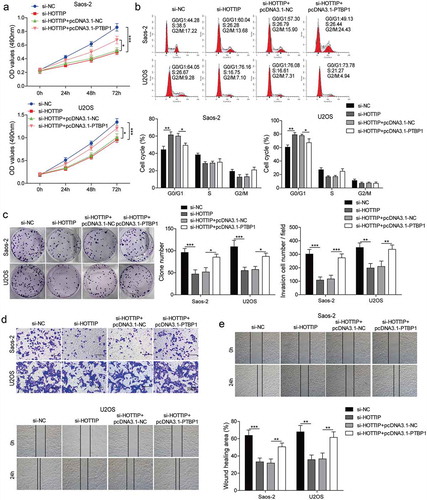
Figure 6. HOTTIP modulates the expression of KHSRP through binding to PTBP1. (a, b) qRT-PCR assay analyzed the expression levels of PTBP1 and KHSRP. (c, d) Correlation analysis between the expression level of PTBP1 and KHSRP or HOTTIP in clinical samples. (e, f) Expression of PTBP1 and KHSRP mRNAs of Saos-2 and USOS cells were examined by qRT-PCR after transfection of pcDNA3.1 or pcDNA3.1-PTBP1. (g) Expression of PTBP1 and KHSRP proteins of Saos-2 and USOS cells were tested by western blot after transfection of pcDNA3.1 or pcDNA3.1-PTBP1. (h, i) The levels of KHSRP were detected via qRT-PCR in si-PTBP1/pcDNA3.1-PTBP1 transfected OS cells treated with actinomycin D at 0, 2, 4 h. 18s rRNA was used as negative control. (g, h) The expression levels of KHSRP were detected via qRT-PCR and western blot in cells transfected with si-HOTTIP and pcDNA3.1-PTBP1. All data were represented by 3 independent experiments. *P < 0.05; **P < 0.01; ***P < 0.001
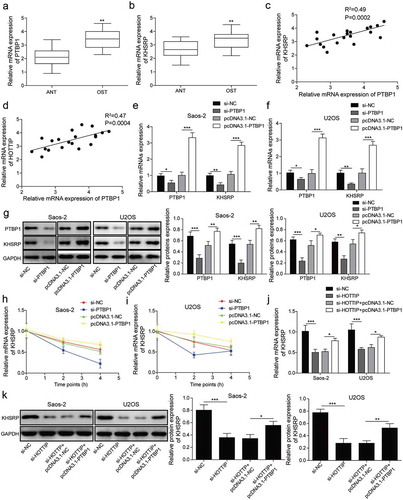
Figure 7. KHSRP involves in HOTTIP facilitated OS progression in vitro. (a) Cell viability of OS cells transfected with si-HOTTIP and pcDNA3.1-KHSRP was detected using CCK-8. (b) Cell cycle of OS cells treated with si-HOTTIP and pcDNA3.1-KHSRP was analyzed by flow cytometry analysis. (c) Colony formation assay was used to estimate colony-formation ability of cells transfected as described in (A). (d) Flow cytometry was allowed to test the effects of HOTTIP/KHSRP axis on cell apoptosis. (e-f) Cell invasion and migration were measured by transwell and wound healing assays. (g) Protein expression of β-catenin, cyclin D1 and c-myc were examined by western blot in OS cells treated with si-HOTTIP and pcDNA3.1-KHSRP. All data were represented by 3 independent experiments. *P < 0.05; **P < 0.01; ***P < 0.001
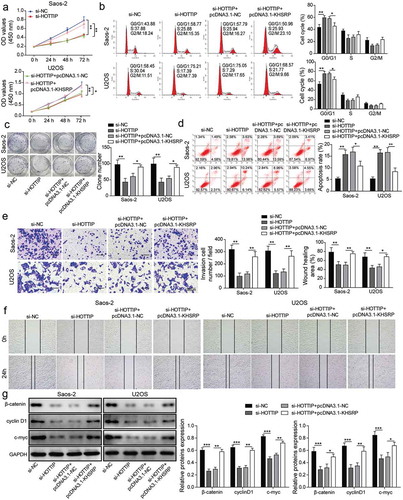
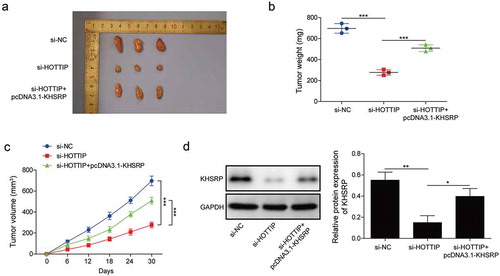
Figure 8. KHSRP overexpression reverses the inhibitory effects of si-HOTTIP on OS tumor growth in vivo. (a) Representative of OS tumors derived from U2OS cells treated with si-HOTTIP plus pcDNA3.1-KHSRP. (b, c) Tumor weight and volume were examined. (d) Protein expression of KHSRP was examined in tumors derived from U2OS cells treated with si-HOTTIP plus pcDNA3.1-KHSRP. All data were represented by 3 independent experiments. *P < 0.05; **P < 0.01; ***P < 0.001