Figures & data
Figure 1. miR-365 overexpression inhibited GBC cells proliferation. A. GBC-SD and SGC-996 cells infected with miR-365 overexpression virus show a significant increase in miR-365 levels compared to the control, as revealed by RT-PCR. (n = 3 independent experiments; P < 0.05). B. The proliferation in GBC-SD miR-365 or SGC-996 miR-365 and their control cells were performed by CCK8 assay. (n = 6 independent experiments). C. Both GBC-SD miR-365 and SGC-996 miR-365 cells formed fewer and smaller clones than their control cells. A colony formation assay was used for the analysis. (n = 3 independent experiments). D. The proliferation in GBC-SD miR-365 or SGC-996 miR-365 and their control cells were performed by EdU immunofluorescence staining assay (red). Nuclei were stained with Hoechst 33,342 (blue). (n = 3 independent experiments)
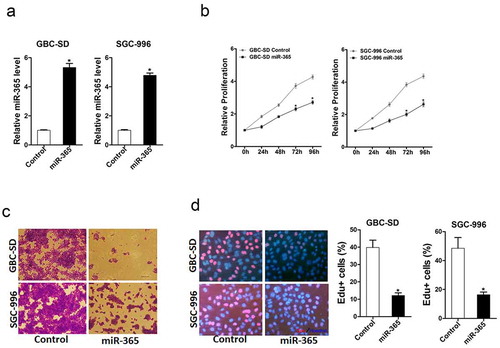
Figure 2. miR-365 overexpression suppressed GBC cells migration and invasion. A. The migration ability of GBC-SD miR-365 and its control cells were performed using transwell assay. The result showed that the migration ability was impaired in GBC-SD miR-365 cells. (n = 3 independent experiments). B. The migration ability of SGC-996 miR-365 and its control cells were performed using transwell assay. The result showed that the migration ability was impaired in SGC-996 miR-365 cells. (n = 3 independent experiments). C. The invasive properties of GBC-SD miR-365 and control cells were analyzed using Matrigel-coated Boyden chamber. The result showed that the invasion ability was impaired in GBC-SD miR-365 cells. (n = 3 independent experiments). D. The invasive ability of SGC-996 miR-365 and its control cells were performed using Invasion chamber. The result showed that the invasion ability was impaired in SGC-996 miR-365 cells. (n = 3 independent experiments)
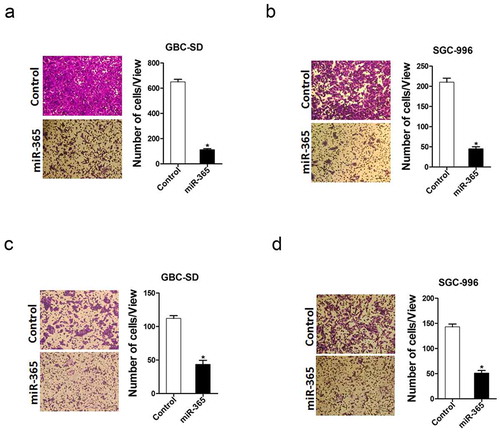
Figure 3. miR-365 expression was downregulated in GBC CSCs. A. GBC cells were cultured in monolayer or ultra-low attachment conditions. miR-365 expression in spheroids and attached cells was compared by real-time PCR. miR-365 expression was downregulated in GBC spheres. (n = 3 independent experiments). B. The expression of miR-365 in serial passages of GBC-SD or SGC-996 spheroids was checked by real-time PCR. miR-365 expression was gradually decreased. (n = 3 independent experiments). C. GBC cell–derived spheroids were trypsinized and cultured in attachment conditions. miR-365 expression in spheroids versus reattached cells was compared by RT- PCR. miR-365 expression was downregulated in GBC spheres and recovered to normal level in reattached condition. (n = 3 independent experiments). D. CD44+ GBC cells were sorted by flow cytometry and the expression of miR-365 was determined by real-time PCR assay. miR-365 expression was downregulated in CD44+ GBC cells compared with CD44- cells. (n = 3 independent experiments). E. CD133+ GBC cells were sorted by flow cytometry and the expression of miR-365 was determined by real-time PCR assay. miR-365 expression was downregulated in CD133+ GBC cells compared with CD133- cells. (n = 3 independent experiments)
Figure 4. Overexpressing miR-365 suppressed GBC CSCs propagation. A. Both GBC-SD miR-365 and SGC-996 miR-365 cells formed fewer spheres than their control cells. A spheroids formation assay was used for the analysis. (n = 3 independent experiments; P < 0.05). B. Both GBC-SD miR-365 and SGC-996 miR-365 cells show a significant decrease in proportion of CD44+ or CD133+ compared to the control, as revealed by flow cytometry. (n = 3 independent experiments; P < 0.05). C. The frequency of gallbladder CSCs in SGC-996 miR-365 or GBC-SD miR-365 and their control cells was determined by in vitro limiting dilution assay. The frequency of gallbladder CSCs in SGC-996 miR-365 or GBC-SD miR-365 was downregulated. (n = 8 independent experiments). D. Both GBC-SD miR-365 and SGC-996 miR-365 cells show a significant decrease in stemness-associated transcription factors and CSCs markers compared to the control, as revealed by RT-PCR. (n = 3 independent experiments; P < 0.05)

Figure 5. RAC1 was a direct target of miR-365 in GBC cells. A. A potential target site for miR-365 in the 3ʹ-UTR of human RAC1 mRNA, as predicted by the program Targetscan. To disrupt the interaction between miR-365 and RAC1 mRNA, the target site was mutated. B. Luciferase reporter assays performed in SGC-996 miR-365 or GBC-SD miR-365 and their control cells transfected with wild-type or mutant RAC1 3’ -UTR constructs. (n = 3 independent experiments). C. Both GBC-SD miR-365 and SGC-996 miR-365 cells show a significant decrease in RAC1 mRNA levels compared to the control, as revealed by RT-PCR. (n = 3 independent experiments; P < 0.05). D. Both GBC-SD miR-365 and SGC-996 miR-365 cells show a significant decrease in RAC1 protein levels compared to the control, as revealed by western blot. (n = 3 independent experiments; P < 0.05). E. SGC-996 miR-365 or GBC-SD miR-365 and their control cells were treated with EHop-016 (10 μM) or not and subjected to CCK8 assay. (n = 6 independent experiments). F. SGC-996 miR-365 or GBC-SD miR-365 and their control cells were treated with EHop-016 (10 μM) or not and subjected to invasion chamber. (n = 3 independent experiments). G. SGC-996 miR-365 or GBC-SD miR-365 and their control cells were treated with EHop-016 (10 μM) or not and subjected to spheroid formation. (n = 3 independent experiments)
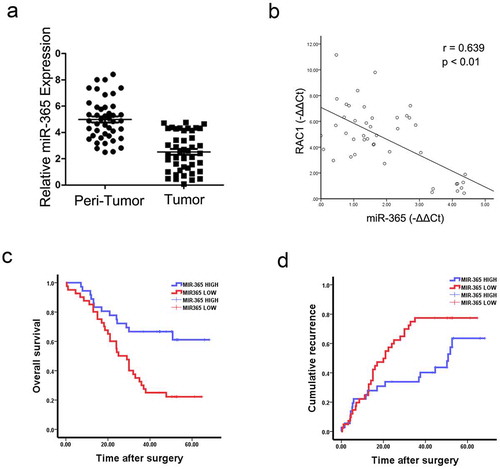
Figure 6. Expression of miR-365 was reduced in human GBC tissues. A. The mRNA expression of miR-365 in 44 pairs of GBC tissues (t) and their neighboring noncancerous tissues (n) was checked by real-time PCR analysis. miR-365 expression was reduced in GBC tissues (T) than their neighboring noncancerous tissues (N). B. Spearman correlation analysis of the relationship between RAC1 protein and miR-365 expression in 44 GBC specimens. C&D. RT-PCR and the expression of miR-365 were scoring in 80 human GBC samples. OS (p = 0.001) and DFS (p = 0.035) after surgery were compared between “low- miR-365 “ group (n = 40) and “high- miR-365” group (n = 40)