Figures & data
Figure 1. Inhibition of TORC1 extends lifespan via activation of Maf1 and subsequent inhibition of Pol III. TORC1 phosphorylates and thus inactivates Maf1, leading to an elevated level of Pol III-directed transcription to promote tRNA and 5S rRNA synthesis. High levels of transcription lead to frequent collisions between the transcription machinery and the replisome, resulting in DNA damage and accelerated aging. mTOR also activates a variety of growth-promoting pathways, leading to aging. Calorie or dietary restrictions inhibit mTOR, minimizing aging processes via activation of Maf1 and subsequent inhibition of Pol III
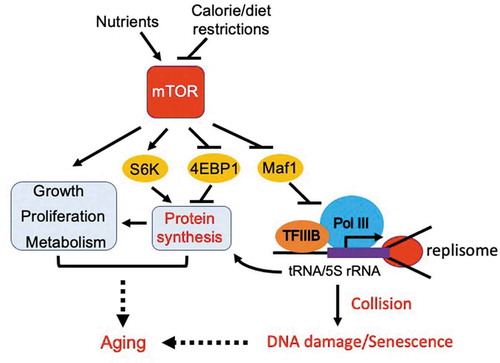
Figure 2. Maf1 phosphorylation dictates lifespan. (a) Maf1 is regulated by the TORC1 kinase via phosphorylation. This phosphorylation is reversed by PP2A phosphatases. Maf1 inactivation results in Pol III activation and elevated DNA damage, and thus lifespan shortening. Maf1 activation inactivates Pol III to limit DNA damage, leading to longer lifespan. (b) Schematic drawing of Maf1 orthologs from humans, S. pombe, S. cerevisiae, Drosophila, and C. elegans. Phosphorylation sites and total amino acid numbers are shown
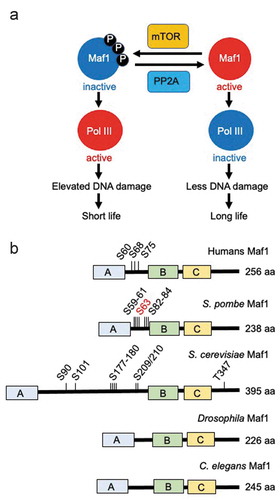
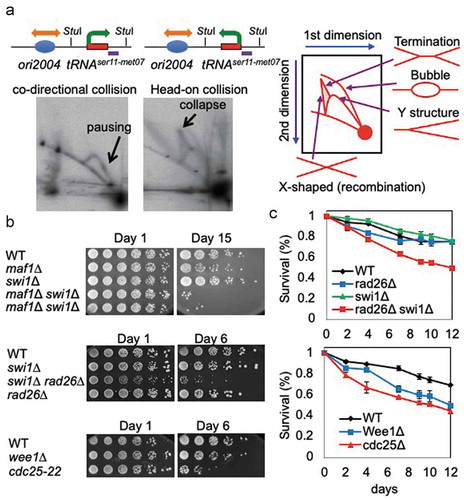
Figure 3. Replication stress contributes to lifespan shortening. (a) 2D-gel analysis of replication forks in cells with pTKS-ori2004-tRNAser11met07Rear (left) or pTKS-ori2004-tRNAser11met07Head (right). Plasmids isolated from the cells were digested with StuI. The tRNAser11-met07 gene, within the StuI fragment, was analyzed via Southern blot. Schematic diagrams show the orientations of DNA replication and transcription. StuI restriction sites and the probed region are indicated. A diagram of the migration pattern of replication intermediates that can be detected in 2D-gel is shown. (b) Cells of the indicated genotypes were first grown under calorie restriction (0.1% glucose) for 1, 6, or 15 days in liquid medium. Fivefold serial dilutions of cells were then plated on solid agar medium containing 3% glucose to test cell viability. (c) The indicated cells were grown to stationary phase in liquid medium. The cultures were maintained at the indicated temperature for up to 12 days and cells were spread on agar medium to allow for colony formation. The number of colonies was counted to obtain colony formation unit per ml, and the survival rate of the 0-day culture was set to 1. Error bars correspond to standard deviations obtained from three independent experiments