
Figures & data
Figure 1. MR protects OLN-93 cells against H2O2-induced death. (a) Effects of MR on the viability of OLN-93 cell. MR did not influence the viability of cell at concentrations of 100, 200, 300, and 400 μM; (b–d) Protective effects of MR pretreatment on H2O2-induced cytotoxicity in OLN-93 cells. Cells were pretreated with different concentrations of MR (100–400 µM) for 24 h and then incubated in the absence or presence of 100 µM H2O2 for 12 h. (b) Viability was assessed by the MTT reduction assay. (c) MR (200 µM) inhibited the release of lactate dehydrogenase (LDH) in OLN-93 cells induced by H2O2. (d) MR suppressed the changes of morphological induced by H2O2. Scale bar, 50 µm. #P< 0.01 vs. the control group; *P< 0.05, **P< 0.01 vs. the only H2O2 treatment group
Figure 2. MR inhibits H2O2-induced apoptosis of OLN-93 cells. (a–d) Apoptotic nuclei of OLN-93 cells were stained by Hoechst 33342. The arrow indicates condensed nuclear cells. (a) Control group; (b) cells induced by H2O2 (100 µM) with condensed nuclei; (c) cells administrated with 200 µM MR for 24 h displayed attenuated sensitivity to H2O2 (100 µM), as evidenced by fewer cells with condensed nuclei. (e–h) Apoptotic cells were detected by TUNEL (green), and the nuclei were detected by DAPI (blue). (e) Control group; (f) cells induced by H2O2 (100 µM) with condensed nuclei; (g) cells were administrated with 200 µM MR followed by 100 µM H2O2 for 12 h. Quantitative analyses are shown in panels (d) and (h). Scale bar, 20 µm. *P< 0.01 vs. the control group; #P< 0.01 vs. the only H2O2 treatment group
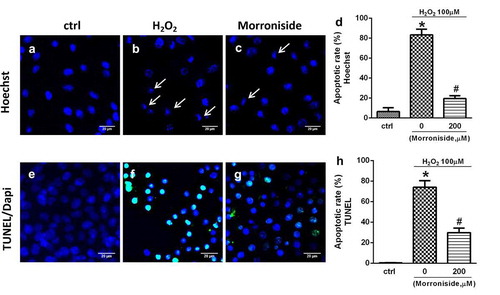
Figure 3. MR inhibits the elevation of intracellular ROS level induced by H2O2. (a) Control group; (b) OLN-93 cells incubated with 200 µM MR; (c) cells exposed to 100 µM H2O2; (d) cells pretreated with 200 µM MR for 24 h prior to induced by H2O2 (100 µM) for 12 h. Scale bar, 50 µm. Quantitative analysis is shown in E. *P< 0.01 vs. the control group and the 200 µM MR group, respectively; #P< 0.05 vs. the only H2O2 treatment group
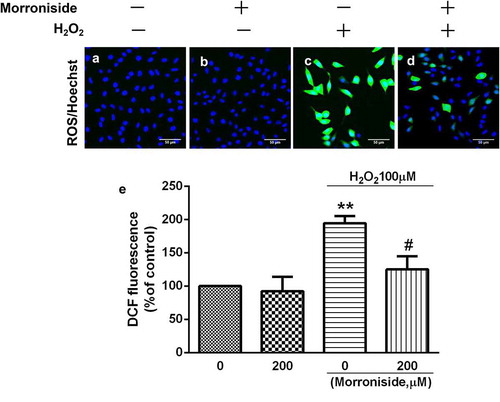
Figure 4. Effect of MR on H2O2-induced lipid oxidation. Cells were pretreated with 200 µM MR for 24 h followed by 100 µM H2O2 for 12 h. *P< 0.05 vs. the control group; #P< 0.05 vs. the only H2O2 treatment group
Figure 5. Inhibition of H2O2-induced reduction in mitochondrial membrane potential (MMP) by MR. (a) Cells were administrated with 200 µM MR for 24 h prior to exposure to H2O2 (100 µM) for 12 h. Aggregated (red) or monomeric (green) cell morphological images were taken under a fluorescence microscope. (b) The ratio of aggregated and monomeric JC-1 was used to quantify the change of MMP. Bar diagram showing the loss of MMP by MR. Scale bar, 50 µm. *P< 0.01 vs. the control group; #P< 0.01 vs. the only H2O2 treatment group
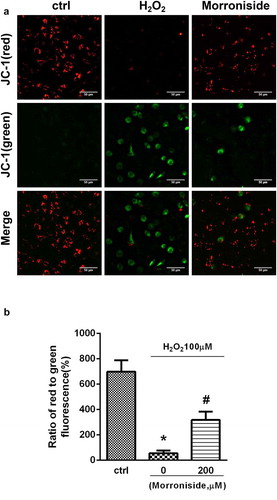
Figure 6. Effect of MR on the expression of oxidation-related proteins. (a) Cells were pretreated with 200 µM MR for 24 h, followed by incubation in the presence of 100 µM H2O2 for 12 h. The cells were analyzed by SDS-PAGE followed by western blot analysis. (b–c) The levels of SOD2 and iNOS were quantified by densitometric analysis.*P< 0.01 vs. the control group; #P< 0.01 vs. the only H2O2 treatment group
Figure 7. Effect of MR on the expression of apoptosis-related proteins in OLN-93 cells. (a) Cells were pretreated with 200 µM MR for 24 h and then incubated in the presence of 100 µM H2O2 for 12 h. The cells were analyzed by SDS-PAGE followed by western blot analysis. (b–d) The levels of cleaved-caspase3, bcl-2, and Bax were quantified by the densitometric analysis. *P< 0.05 vs. the control group; #P< 0.05 vs. the only H2O2 treatment group
Figure 8. MR rescues H2O2-induced downregulation of p-AKT in OLN-93 cells. (a) Cells were pretreated with 200 µM MR for 24 h and then incubated in the presence of 100 µM H2O2 for 12 h. The cells were analyzed by SDS-PAGE followed by western blot analysis. (b) Relative levels of p-AKT versus total AKT in each sample as determined by blot densitometry. Densitometric analysis of the immunoblot was expressed as a fold of control. *P< 0.05 vs. the control group; #P< 0.05 vs. the only H2O2 treatment group
Figure 9. LY294002 blocks the protective role of MR on H2O2-induced apoptosis in OLN-93 cells. (a) OLN-93 cells were preincubated with LY294002 for 1 h and then pretreated with MR for 24 h, followed by incubation with H2O2 for 12 h. Apoptotic cells were detected by TUNEL (green), and the nuclei were detected by DAPI (blue). Quantitative analyses are shown in panel B. Scale bar, 50 µm. **P<0.01 vs. the control group; ##P<0.01 vs. the only H2O2 treatment group; &P<0.05 and $P<0.05 vs. MR+H2O2.
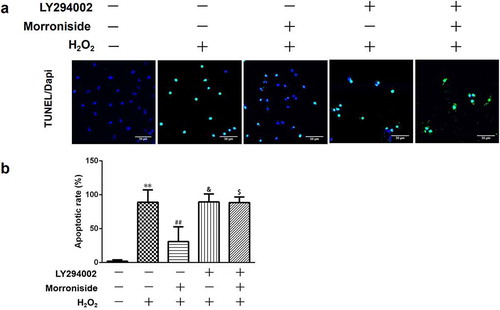
Figure 10. LY294002 blocks inhibitory effects of MR on H2O2-induced ROS overproduction. OLN-93 cells were preincubated with LY294002 for 1 h and then pretreated with MR for 24 h, followed by incubation with H2O2 for 12 h. **P<0.01 vs. the control group; ##P<0.01 vs. the only H2O2 treatment group; &&P<0.01 and $$P<0.01 vs. MR+H2O2.
Figure 11. MR modulates the expression of apoptosis-related proteins by increasing Akt phosphorylation. Cells were preincubated with LY294002 for 1 h and then pretreated with MR for 24 h, followed by incubation with H2O2 for 12 h. The cells were analyzed by SDS-PAGE followed by western blot analysis (a and f). Relative levels of p-AKT versus total AKT in each sample as determined by blot densitometry (b). Densitometric analysis of the immunoblot was expressed as a fold of control (b–f). **P<0.01 vs. the control group; ##P<0.01 vs. the only H2O2 treatment group; &&P<0.05 and $$P<0.05 vs. MR+H2O2.
Data Availability
The data used to support the findings of this study are available from the corresponding author upon request.