Figures & data
Figure 1. Isolation and characterization of DFs and DF-Ex. (a) The morphology of primary DFs was observed using an optical microscope (scale bar = 250 μm). (b) DFs were identified with FAP and Vimentin through western blotting. (c) The morphology of DF-Ex was observed using a transmission electron microscope (scale bar = 100 nm). (d) The size distribution of DF-Ex was detected through nanosight tracking analysis. (e) The exosomal markers were analyzed through western blotting
Figure 2. DF-Ex reversed damaging effects of high glucose on HUVECs. (a) The internalization of DiI-labeled DF-Ex by HUVECs was observed using a confocal fluorescence microscope (scale bar = 20 μm). (b) The proliferation of HUVECs treated with/without high glucose or DF-Ex was determined through a cell colony formation assay (n = 3). (c) A transwell assay indicated the migration ability of HUVECs with/without high glucose or DF-Ex treatment (scale bar = 200 μm, n = 3). (d) A scratch wound healing assay revealed the motility of HUVECs with/without high glucose or DF-Ex treatment (scale bar = 1000 μm, n = 3). (e) The tube formation ability of HUVECs treated with/without high glucose or DF-Ex was determined through a tube formation assay (scale bar = 400 μm, n = 3). (f) The cell viability of HUVECs with different treatments was detected through a CCK-8 assay (n = 3). (g) qRT-PCR for the relative mRNA levels of inflammatory cytokines (IL-1β, IL-6, IL-10) in HUVECs (n = 3). (h) The expression levels of proliferation (PCNA, Bcl-2), apoptosis (Bax) and angiogenesis (VEGF-A) related proteins were detected through western blotting (n = 3). (b–h) *p < 0.05, **p < 0.01, ***p < 0.001, ns: no significance
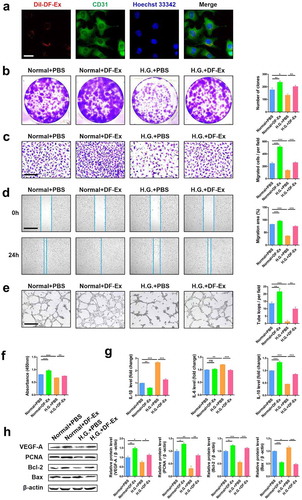
Figure 3. DF-Ex accelerated cutaneous wound healing in diabetic rats. (a) Representative images of wound healing process at day 0, 6, 12, and 15. (b) Wound closure rates of two groups were analyzed at day 6, 12, and 15 (n = 6). (c) Images of whole skin sections with HE staining harvested at day 15 (scale bar = 1000 μm). (d) The protein levels of PCNA, Bcl-2 and Bax were analyzed through western blotting at day 15 (n = 3). (b, d) *p < 0.05, **p < 0.01, ***p < 0.001
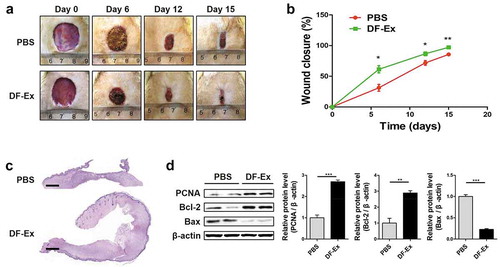
Figure 4. Histological analysis of diabetic cutaneous wound healing at day 15. (a) HE staining was used to detect skin structure in the wounds. (b) The distribution of collagen fibers in skin tissues was analyzed through Sirius Red staining. (c) IHC was used to detect the expression level of PCNA in the wounds. (d) IHC was used to detect the expression level of CD31 in the wounds. (e) IHC was used to detect the expression level of the inflammatory cytokine IL-6 in the wounds. (a–e) Sections in the rectangle are magnified on the right, scale bar = 50 μm. (c–e) n = 3, *p < 0.05, **p < 0.01
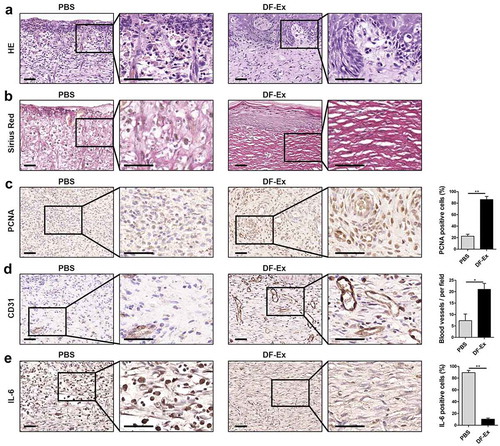
Figure 5. DF-Ex alleviated high glucose damage to HUVECs through the Akt/β-catenin pathway in vitro. (a) The expression levels of p-Akt, t-Akt and β-catenin in HUVECs were detected through western blotting (β-actin as the internal control for β-catenin, t-Akt as the internal control for p-Akt, n = 3). (b) The expression and localization of p-Akt in HUVECs was analyzed through IF (scale bar = 100 μm, n = 3). (c) The expression and localization of β-catenin in HUVECs was detected through IF (scale bar = 100 μm, n = 3). (a–c) *p < 0.05, **p < 0.01, ***p < 0.001, ns: no significance
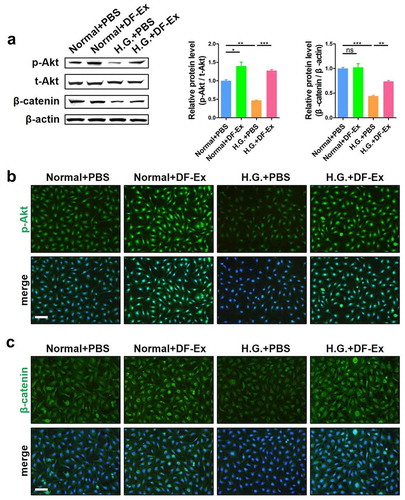
Figure 6. DF-Ex accelerated cutaneous wound healing in T2DM rats through the Akt/β-catenin pathway in vivo. (a) The protein levels of p-Akt, t-Akt and β-catenin in skin tissues were analyzed through western blotting (n = 3). (b) Activation of the Akt pathway in vivo was assessed through IHC (scale bar = 50 μm, n = 3). (c) The expression and localization of β-catenin in skin tissues was assessed through IHF (scale bar = 100 μm, n = 3). (a–c) **p < 0.01, ***p < 0.001
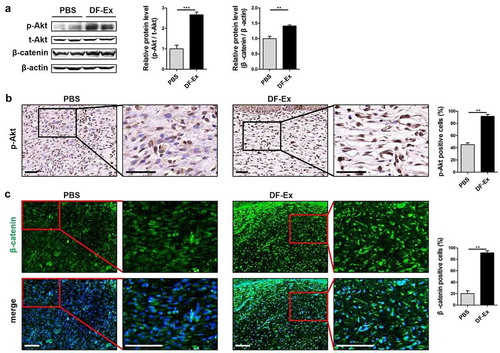
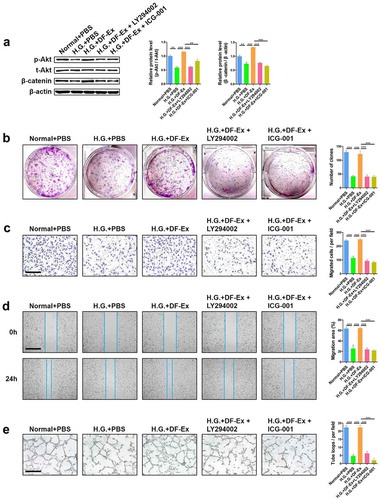
Figure 7. Interference in activation of the Akt/β-catenin pathway made DF-Ex ineffective. (a) LY294002 (Beyotime, #S1737, 10 μM) and ICG-001 (Selleck, #S2662, 10 μM) were used to suppress the activation of Akt and β-catenin respectively. Western blotting was used to detect the expression levels of p-Akt, t-Akt and β-catenin in HUVECs with different treatments (n = 3). (b) A cell colony formation assay was used to detect the proliferation ability of HUVECs with different treatments (n = 3). (c) A transwell assay indicated the migration ability of HUVECs with different treatments (scale bar = 200 μm, n = 3). (d) A scratch wound healing assay revealed the motility of HUVECs with different treatments (scale bar = 1000 μm, n = 3). (e) The tube formation ability of HUVECs with different treatments was determined through a tube formation assay (scale bar = 400 μm, n = 3). (a–e) **p < 0.01, ***p < 0.001