Figures & data
Table 1. Primer sequences for RT-qPCR
Figure 1. DEX has a dose-dependent inhibitory effect on OC growth and invasion. A, cell viability detected using MTT assay; B, number of cell colonies detected using colony formation assay; C, cell proliferation measured using EdU assay; D, cell apoptosis detected using flow cytometry; E, cell apoptosis detected using TUNEL assay; F, expression of apoptosis-related proteins detected using Western blot analysis; G, cell invasion evaluated using Transwell assay; H, cell migration detected using scratch test; all experiments were performed for three times, and data in panels B/C/D/E/G/H were analyzed using one-way ANOVA, and data in panels A/F were analyzed using two-way ANOVA, followed by Tukey’s multiple comparisons test; *, p < 0.05; **, p < 0.01
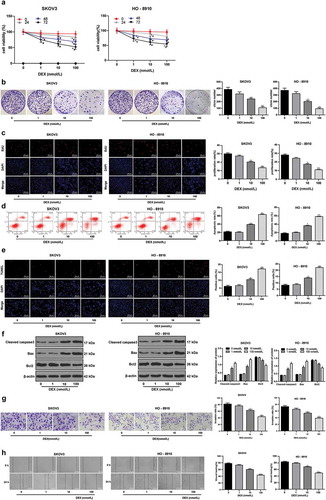
Figure 2. DEX inhibits OC proliferation and invasion by upregulating miR-185 expression. miR-185 with low or over expression was transfected into HO-8910 cells treated with 100 nmol/L DEX. A, miR-185 expression detected using RT-qPCR; B, cell viability detected using MTT assay; C, number of cell colonies detected using colony formation assay; D, cell proliferation measured using EdU assay; E, cell apoptosis detected using flow cytometry; F, cell apoptosis detected using TUNEL assay; G, expression of apoptosis-related proteins detected using Western blot analysis; H, cell invasion evaluated using Transwell assay; I, cell migration detected using scratch test; all experiments were performed for three times, and data in panels A/B/C/D/E/F/H/I were analyzed using one-way ANOVA, and data in panel G were analyzed using two-way ANOVA, followed by Tukey’s multiple comparisons test; *, p < 0.05; **, p < 0.01
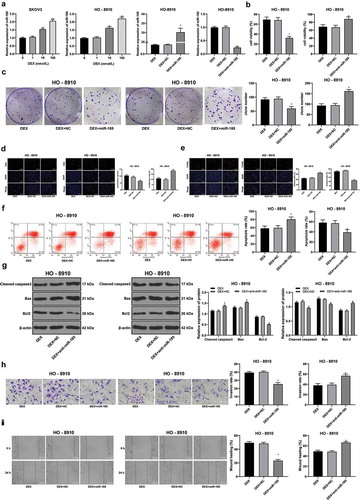
Figure 3. miR-185 directly binds to SOX9. A, target relation between miR-185 and SOX9 predicted via miRNA.org website; B, target relation between miR-185 and SOX9 identified using dual-luciferase reporter gene assay; C, SOX9 mRNA expression in OC cells detected using RT-qPCR; D, SOX9 protein expression in OC cells detected using Western blot analysis; the experiment was performed for 3 times; in panels C and D, data were analyzed using one-way ANOVA, and in panel B, data were analyzed using two-way ANOVA, followed by Tukey’s multiple comparisons test; *, p < 0.05; **, p < 0.01
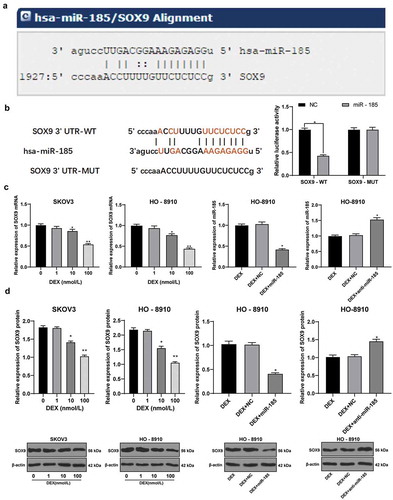
Figure 4. SOX9 knockdown inhibits OC cells proliferation and metastasis. SOX9 siRNA was transfected into HO-8910 cells with anti-miR-185, and NC siRNA was used as control, and then cells were treated with 100 nmol/L DEX. A, cell viability detected using MTT assay; B, number of cell colonies detected using colony formation assay; C, DNA replication measured using EdU assay; D, cell apoptosis detected using flow cytometry; E, cell apoptosis rate detected using TUNEL assay; F, expression of apoptosis-related proteins detected using Western blot analysis; G, cell invasion evaluated using Transwell assay; H, cell migration detected using scratch test; all experiments were performed for 3 times and t test was used to analyze statistical significance in panels A/B/C/D/E/G/H, and two-way ANOVA and Tukey’s multiple comparisons test were used to analyze data in panel F. *, p < 0.05
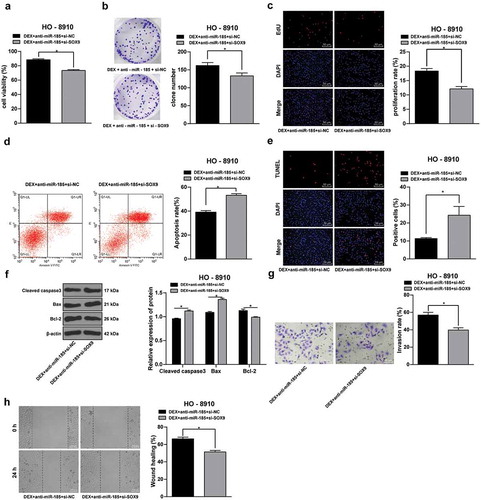
Figure 5. DEX inactivates the Wnt/β-catenin signaling pathway via the miR-185/SOX9 axis. A-B, protein expression of key factors in Wnt/β-catenin signaling pathway (β-catenin, C-myc and cyclinD1) detected using Western blot analysis; C, fluorescence intensity of β-catenin evaluated using immunofluorescence assay; the experiment was performed for 3 times and two-way ANOVA was used to determine statistical significance in panels A/B; *, p < 0.05; **, p < 0.01
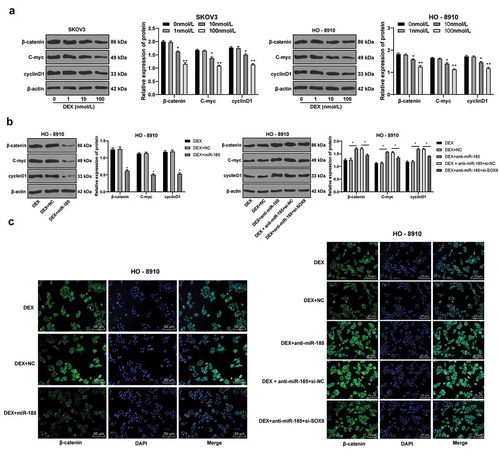
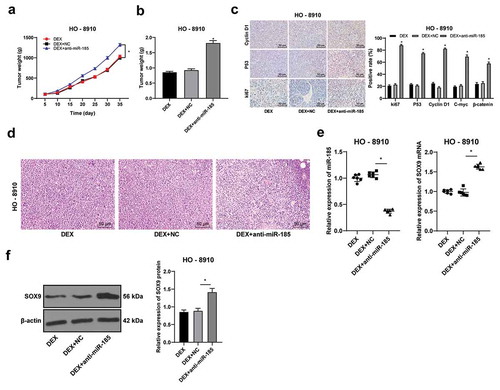
Figure 6. DEX suppresses OC tumor growth in vivo. HO-8910 cells with low or over expression of miR-185 were subcutaneously injected into nude mice, and then treated with 100 nmol/L DEX. A, tumor volume detection after OC cell transfection; B, tumor weight detection after OC cell transfection; C, ki67, cyclinD1 and p53 expression detected using immunohistochemistry; D, morphologies of tumor tissues observed using HE staining; E: the expression of miR-185 and SOC9 was detected by RT-qPCR; F, SOX9 protein level detected by Western blot. N = 6. In panels B and E, one-way ANOVA was used to determine statistical significance; in panels A and C, two-way ANOVA was used to determine statistical significance, followed by Tukey’s multiple comparisons test; *, p < 0.05