
Figures & data
Figure 1. Bevacizumab resistance mechanisms and YKL-40 signaling in cancer. Bevacizumab resistance mechanisms include (1) vessel co-option; (2) intussusception; (3) recruitment of BMDCs and CAFs; (4) vascular mimicry; (5) production of alternative angiogenic factors by hypoxic tumor cells; (6) pericyte coverage of blood vessels [Citation6,Citation7]; (7) enhanced invasion of cancer cells into normal brain parenchyma; and (8) mesenchymal transition of tumor cells associated with increased invasiveness, stemness, and metabolic reprogramming [Citation6,Citation7,Citation13]. YKL-40 production is regulated by tumor–astrocyte–microglia/macrophage crosstalk in the brain tumor microenvironment [Citation19,Citation49]. Suggested YKL-40 functions are depicted in orange boxes and include bevacizumab resistance mechanisms (4–8) [Citation2,Citation13]; transdifferentiation of GSCs into pericytes or smooth muscle cells [Citation2]; regulation of endothelial cell-mediated angiogenesis [Citation2,Citation18], apoptosis [Citation21], proliferation and immune modulation, which may be partly mediated by changes in cytokine and chemokine production [Citation58–61]. BMDC, bone marrow-derived cell; BTME, brain tumor microenvironment; CAF, cancer-associated fibroblast; EC, endothelial cell; GSC, glioma stem-like cell
![Figure 1. Bevacizumab resistance mechanisms and YKL-40 signaling in cancer. Bevacizumab resistance mechanisms include (1) vessel co-option; (2) intussusception; (3) recruitment of BMDCs and CAFs; (4) vascular mimicry; (5) production of alternative angiogenic factors by hypoxic tumor cells; (6) pericyte coverage of blood vessels [Citation6,Citation7]; (7) enhanced invasion of cancer cells into normal brain parenchyma; and (8) mesenchymal transition of tumor cells associated with increased invasiveness, stemness, and metabolic reprogramming [Citation6,Citation7,Citation13]. YKL-40 production is regulated by tumor–astrocyte–microglia/macrophage crosstalk in the brain tumor microenvironment [Citation19,Citation49]. Suggested YKL-40 functions are depicted in orange boxes and include bevacizumab resistance mechanisms (4–8) [Citation2,Citation13]; transdifferentiation of GSCs into pericytes or smooth muscle cells [Citation2]; regulation of endothelial cell-mediated angiogenesis [Citation2,Citation18], apoptosis [Citation21], proliferation and immune modulation, which may be partly mediated by changes in cytokine and chemokine production [Citation58–61]. BMDC, bone marrow-derived cell; BTME, brain tumor microenvironment; CAF, cancer-associated fibroblast; EC, endothelial cell; GSC, glioma stem-like cell](/cms/asset/fd579d4a-a974-473b-89cf-6132258ed682/kccy_a_1901037_f0001_c.jpg)
Figure 2. Characterization of GBM cell lines and dual inhibition of VEGF-A and YKL-40. YKL-40 protein abundance in 10 primary (G14, G17, G18, G26, G48) and low passage xenograft (G06, G07, G11, G16, G20) human GBM cell lines are depicted in a representative western blot (n = 3) in (a) and YKL-40 secretion in conditioned media in (b) is presented as mean and SEM (n = 2, 3 replicates per n). Cell lines were divided in YKL-40High (red) and YKL-40Low (table in b) based on YKL-40 protein abundance and secretion. (c) Representative graph of YKL-40 in conditioned media from G06 GBM cells treated with IgG, anti-YKL-40, bevacizumab, or anti-YKL-40 and bevacizumab presented as mean YKL-40 concentration and SD (n = 2, 3 replicates per n). (d) Mean serum YKL-40 in mice treated with IgG (n = 7), anti-YKL-40 (n = 9), bevacizumab (n = 9), or anti-YKL-40 and bevacizumab (n = 9). (e) Kaplan–Meier survival analysis of cumulative survival from tumor cell-injection until sacrifice of mice treated with IgG (n = 9), anti-YKL-40 (n = 9), bevacizumab (n = 9), or anti-YKL-40 and bevacizumab (n = 9). In (f), cell lines are divided into molecular subtypes [Citation14] based on RNA sequencing and analyzed for CHI3L1 and VEGFA RNA expression. (g, h) represent hierarchical clustering (g) of four cell lines and paired patient samples and hierarchical clustering corrected for systematic differences between cell lines and patient tumor tissue (h). Cell lines in red are considered YKL-40High. Statistical tests: (c) two-way ANOVA and Tukey’s multiple comparisons test; (d) Kruskal–Wallis test and Dunn’s multiple comparisons test; (e) log-rank test. Statistical significance levels: * p < 0.05; ns, non-significant
![Figure 2. Characterization of GBM cell lines and dual inhibition of VEGF-A and YKL-40. YKL-40 protein abundance in 10 primary (G14, G17, G18, G26, G48) and low passage xenograft (G06, G07, G11, G16, G20) human GBM cell lines are depicted in a representative western blot (n = 3) in (a) and YKL-40 secretion in conditioned media in (b) is presented as mean and SEM (n = 2, 3 replicates per n). Cell lines were divided in YKL-40High (red) and YKL-40Low (table in b) based on YKL-40 protein abundance and secretion. (c) Representative graph of YKL-40 in conditioned media from G06 GBM cells treated with IgG, anti-YKL-40, bevacizumab, or anti-YKL-40 and bevacizumab presented as mean YKL-40 concentration and SD (n = 2, 3 replicates per n). (d) Mean serum YKL-40 in mice treated with IgG (n = 7), anti-YKL-40 (n = 9), bevacizumab (n = 9), or anti-YKL-40 and bevacizumab (n = 9). (e) Kaplan–Meier survival analysis of cumulative survival from tumor cell-injection until sacrifice of mice treated with IgG (n = 9), anti-YKL-40 (n = 9), bevacizumab (n = 9), or anti-YKL-40 and bevacizumab (n = 9). In (f), cell lines are divided into molecular subtypes [Citation14] based on RNA sequencing and analyzed for CHI3L1 and VEGFA RNA expression. (g, h) represent hierarchical clustering (g) of four cell lines and paired patient samples and hierarchical clustering corrected for systematic differences between cell lines and patient tumor tissue (h). Cell lines in red are considered YKL-40High. Statistical tests: (c) two-way ANOVA and Tukey’s multiple comparisons test; (d) Kruskal–Wallis test and Dunn’s multiple comparisons test; (e) log-rank test. Statistical significance levels: * p < 0.05; ns, non-significant](/cms/asset/94bb9cbe-a285-4eee-8522-effa5bd50025/kccy_a_1901037_f0002_c.jpg)
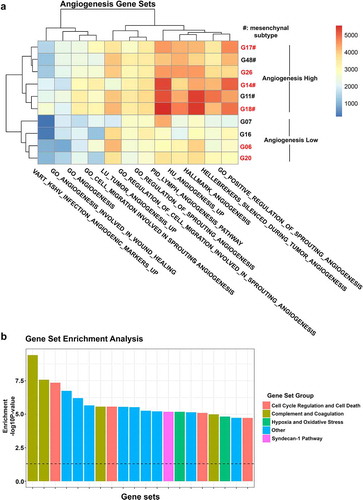
Figure 3. Gene expression analysis of 10 GBM cell lines. (a) Heatmap depicting single sample gene set enrichment of angiogenesis-related gene sets in 10 GBM cell lines. (b) Gene set enrichment analysis showing the 20 most overrepresented gene sets between YKL-40High and YKL-40Low cell lines divided into the groups: Cell Cycle Regulation and Cell Death; Complement and Coagulation; Hypoxia and Oxidative Stress; Other; and Syndecan-1 pathway. A full list of differentially enriched gene sets can be found in Supplementary file 5. Cell lines in red are considered YKL-40High
Supplemental Material
Download Zip (8 MB)Data availability statement
The data sets for this manuscript are not publicly available due to participant confidentiality. Requests to access the data sets should be directed to Camilla Bjørnbak Holst, [email protected].