Figures & data
Table 1. Primer sequences for RT-qPCR
Figure 1. ML264 treatment reduces H/R-induced damage in H9C2 cells. A KLF5-specific inhibitor ML264 was introduced in H/R-treated H9C2 cells at 10 μmol/mL. A-B, mRNA (a) and protein (b) expression of KLF5 in cells determined by RT-qPCR and western blot analysis, respectively (one-way ANOVA, ** p < 0.01 vs. Control, ## p < 0.01 vs. H/R treatment); C-D, viability of cells determined by EdU labeling (c) and CFSE labeling (d) (one-way ANOVA, ** p < 0.01 vs. Control, ## p < 0.01 vs. H/R treatment); E, proliferation of cells determined by CCK-8 method (two-way ANOVA, ** p < 0.01 vs. Control, # p < 0.05, ## p < 0.01 vs. H/R treatment); F, LDH production in cells determined using an LDH kit (one-way ANOVA, ** p < 0.01 vs. Control, ## p < 0.01 vs. H/R treatment); G, Caspase-3 activity in H9C2 cells measured using a Caspase-3 detection kit (one-way ANOVA, ** p < 0.01 vs. Control, ## p < 0.01 vs. H/R treatment); H-I, apoptosis of H9C2 cells determined by Hoechst 33342/PI double staining (h) and flow cytometry (i) (one-way ANOVA, ** p < 0.01 vs. Control, ## p < 0.01 vs. H/R treatment); J-K, mRNA (j) and protein (k) expression of apoptosis-related factors Bax, Bcl-2 and Apaf1 in cells determined by RT-qPCR and western blot analysis, respectively (two-way ANOVA, ** p < 0.01 vs. Control, ## p < 0.01 vs. H/R treatment); L-M, ROS concentration in cells examined using CellROX Green (l) and MitoSox Red (m) kits (one-way ANOVA, ** p < 0.01 vs. Control, ## p < 0.01 vs. H/R treatment). Data were exhibited as mean ± SD from at least three independent experiments
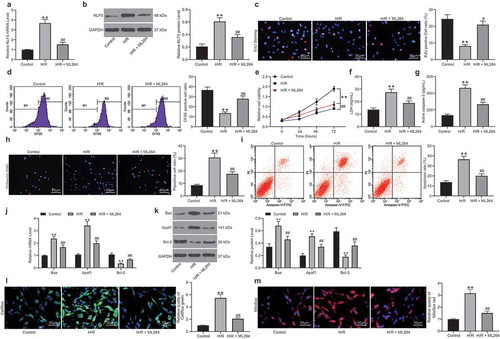
Figure 2. ML264 inhibits H/R-induced fibrosis of H9C2 cells. A-B, invasion and migration abilities of H9C2 cells determined by Transwell assays (one-way ANOVA** p < 0.01 vs. Control ## p < 0.01 vs. H/R treatment); C-D, mRNA (c) and protein (d) expression of fibronectin, Vimentin, α-SMA and Collagen I/II in cells determined by RT-qPCR and western blot analysis, respectively (two-way ANOVA, * p < 0.05, ** p < 0.01 vs. Control, # p < 0.05 vs. H/R treatment); E, Vimentin and α-SMA expression in cells further evaluated by immunofluorescence staining (one-way ANOVA, ** p < 0.01 vs. Control, ## p < 0.01 vs. H/R treatment); F, total collagen content in cells determined by a collagen kit (one-way ANOVA, ** p < 0.01 vs. Control, # p < 0.05 vs. H/R treatment). Data were exhibited as mean ± SD from at least three independent experiments
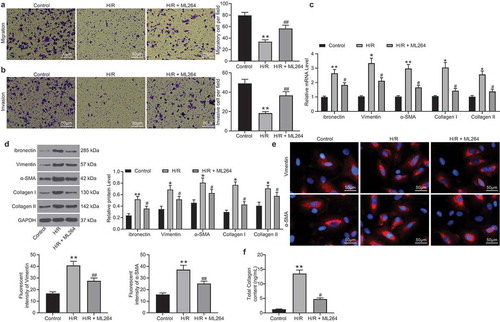
Figure 3. miR-27a is significantly up-regulated in H9C2 cells following ML264 treatment. A, a volcano map for differentially expressed miRNAs in cells following ML264 treatment; B, top 15 differentially expressed miRNAs; C, miR-27a expression in cells determined by RT-qPCR (one-way ANOVA, ** p < 0.01 vs. Control, ## p < 0.01 vs. H/R treatment); D, conservative sequence of KLF5; E, binding sites between KLF5 and the promoter region of miR-27a predicted on JASPAR; F, binding relationship between KLF5 and the promoter region of miR-27a validated through a ChIP-qPCR analysis (two-way ANOVA, ** p < 0.01 vs. anti-IgG). Data were exhibited as mean ± SD from at least three independent experiments
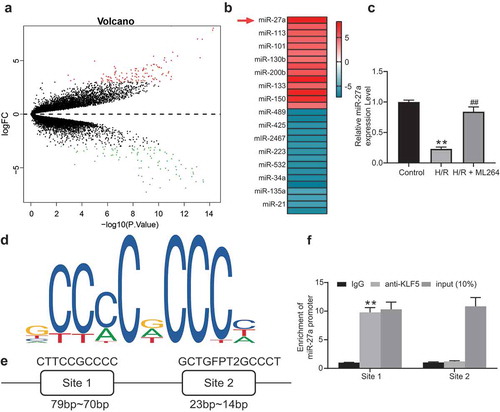
Figure 4. miR-27a mimic suppresses H/R-induced apoptosis and fibrosis in H9C2 cells. miR-27a mimic was introduced in H/R-treated cells while miR-27a inhibitor was transfected into ML264-treated cells. A, miR-27a expression in cells determined by RT-qPCR (one-way ANOVA, ** p < 0.01 vs. Mock, ## p < 0.01 vs. ML264 + miR-27a inhibitor); B-C, viability of cells determined by EdU labeling (b) and CFSE labeling (c) assays (one-way ANOVA, ** p < 0.01 vs. Mock, ## p < 0.01 vs. ML264 + miR-27a inhibitor); D-E, apoptosis of H9C2 cells determined by Hoechst 33342/PI double staining (d) and flow cytometry (e) (one-way ANOVA, ** p < 0.01 vs. Mock, ## p < 0.01 vs. ML264 + miR-27a inhibitor); F-G, mRNA (f) and protein (g) expression of Vimentin and α-SMA in cells determined by RT-qPCR and western blot analysis, respectively. Data were exhibited as mean ± SD from at least three independent experiments (two-way ANOVA, * p < 0.05 vs. Mock, # p < 0.05 vs. ML264 + miR-27a inhibitor). Data were exhibited as mean ± SD from three independent experiments
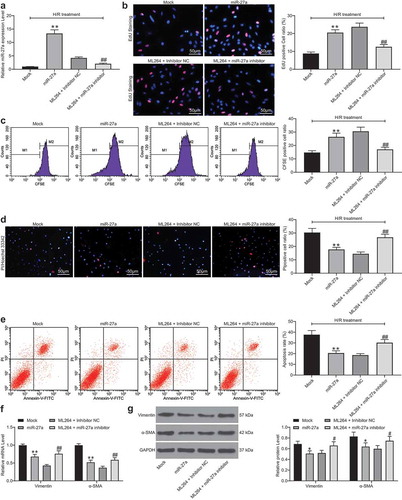
Figure 5. miR-27a targets GFPT2 and inactivates the TGF-β/Smad2/3 signaling pathway. A, intersected target mRNAs of miR-27a predicted on four bioinformatic systems StarBase, TargetScan, miRDB and PicTar; B, binding relationships between miR-27a and GFPT2 or NAFSC mRNA examined through dual-luciferase reporter gene assays (two-way ANOVA, ** p < 0.01 vs. GFPT2-MUT); C, binding relationship between miR-27a and GFPT2 validated through a biotin-labeled RNA pull-down assay (one-way ANOVA, ** p < 0.01 vs. Biotin-NC); D-E, mRNA (d) and protein (e) expression of GFPT2 in cells determined by RT-qPCR and western blot analysis, respectively (one-way ANOVA, ** p < 0.01 vs. control, ## p < 0.01 vs. H/R, && p < 0.01 vs. Mock, @@ p < 0.01 vs. ML264 + inhibitor); F, expression of TGF-β1 and phosphorylation of Smad2/3 in cells determined by western blot analysis (one-way ANOVA, ** p < 0.01 vs. control, ## p < 0.01 vs. H/R, && p < 0.01 vs. Mock, @@ p < 0.01 vs. ML264 + inhibitor). Data were exhibited as mean ± SD from at least three independent experiments
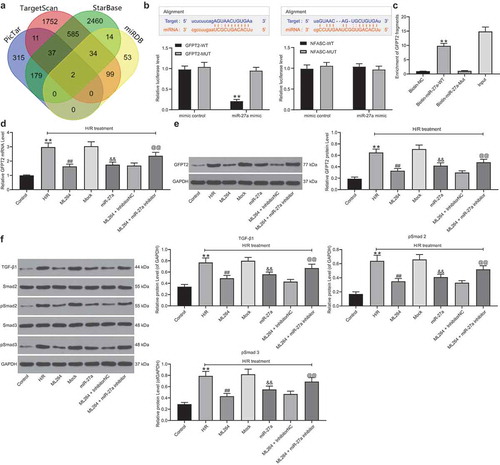
Figure 6. Overexpression of GFPT2 counteracts the protective roles of miR-27a in H/R-induced cell damage. A, GFPT2 expression in H/R-treated cells overexpressing miR-27a determined by western blot analysis 48 h after LV-GFPT2 administration (unpaired t test, ** p < 0.01 vs. miR-27a + LV-NC); B-C, viability of cells determined by EdU labeling (b) and CFSE labeling followed by flow cytometry (c) (unpaired t test, ** p < 0.01 vs. miR-27a + LV-NC); D-E, apoptosis of H9C2 cells determined by Hoechst 33342/PI double staining (d) and flow cytometry (e) (unpaired t test, ** p < 0.01 vs. miR-27a + LV-NC); F-G, mRNA (f) and protein (g) expression of Vimentin and α-SMA in cells determined by RT-qPCR and western blot analysis (two-way ANOVA, * p < 0.05, ** p < 0.01 vs. miR-27a + LV-NC); H, expression of TGF-β1 and phosphorylation of Smad2/3 in cells determined by western blot analysis (two-way ANOVA, * p < 0.05 vs. miR-27a + LV-NC). Data were exhibited as mean ± SD from at least three independent experiments
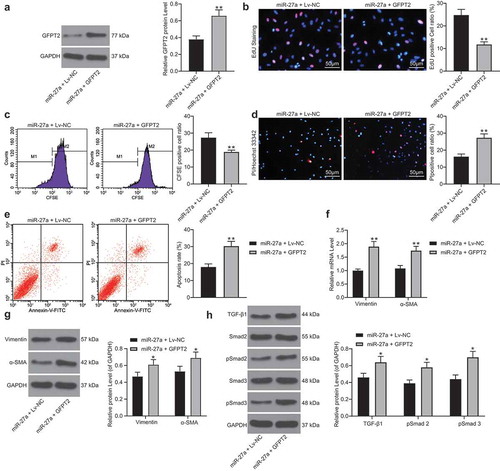
Figure 7. KLF5 transcriptionally suppresses miR-27a expression to activate GFPT2/TGF-β/Smad2/3 signaling pathway to trigger fibrosis in mice with MI. A, a brief diagram for mouse grouping; B, expression of miR-27a and GFPT2 in mouse myocardial tissues examined by RT-qPCR and western blot analysis, respectively (one-way ANOVA, ** p < 0.01 vs. sham, ## p < 0.01 vs. DPBS, && p < 0.01 vs. ML264 + antagomiR NC, @@ p < 0.01 vs. ML264 + Lv-NC); C-D, LVEF and LVFS levels determined by echocardiogram (one-way ANOVA, ** p < 0.01 vs. sham, ## p < 0.01 vs. DPBS, & p < 0.05, && p < 0.01 vs. ML264 + antagomiR NC, @ p < 0.05, @@ p < 0.01 vs. ML264 + Lv-NC); E, levels of LDH and CK-MB in mouse serum determined using an automatic biochemical analyzer while cTnI and cTnT by ELISA kits (one-way ANOVA, ** p < 0.01 vs. sham, ## p < 0.01 vs. DPBS, && p < 0.01 vs. ML264 + antagomiR NC, @@ p < 0.01 vs. ML264 + Lv-NC). There were 10 mice in each group. Data were exhibited as mean ± SD from at least three independent experiments
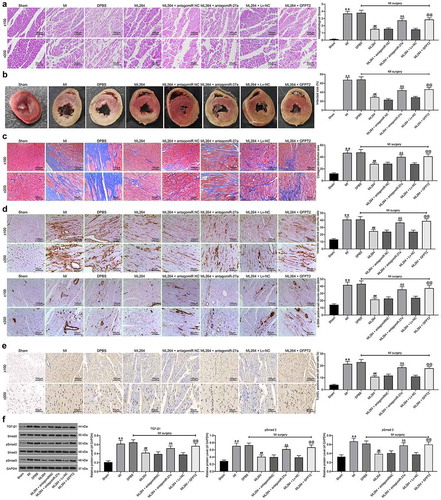
Figure 8. KLF5/miR-27a/GFPT2 axis mediates the TGF-β/Smad2/3 signaling pathway to affect MI progression in mice. A, pathological structure in mouse myocardial tissues determined by HE staining (one-way ANOVA, ** p < 0.01 vs Sham, ## p < 0.01 vs DPBS; && p < 0.01 vs ML264 + antagomiR NC; @@ p < 0.01 vs ML264 + Lv-NC); B, infarct size in mouse myocardial tissues determined by TTC staining (one-way ANOVA, ** p < 0.01 vs Sham, ## p < 0.01 vs DPBS; && p < 0.01 vs ML264 + antagomiR NC; @@ p < 0.01 vs ML264 + Lv-NC); C, fibrosis in myocardial tissues evaluated by Masson’s trichrome staining (one-way ANOVA, ** p < 0.01 vs Sham, ## p < 0.01 vs DPBS; && p < 0.01 vs ML264 + antagomiR NC; @@ p < 0.01 vs ML264 + Lv-NC); D, expression of Vimentin and α-SMA in myocardial tissues detected by immunohistochemistry staining (one-way ANOVA, ** p < 0.01 vs Sham, ## p < 0.01 vs DPBS; && p < 0.01 vs ML264 + antagomiR NC; @@ p < 0.01 vs ML264 + Lv-NC); E, cell apoptosis in mouse myocardial tissues determined by TUNEL assay (one-way ANOVA, ** p < 0.01 vs Sham, ## p < 0.01 vs DPBS; && p < 0.01 vs ML264 + antagomiR NC; @@ p < 0.01 vs ML264 + Lv-NC); F, TGF-β expression and phosphorylation of Smad2/3 in mouse myocardial tissues determined by western blot analysis (one-way ANOVA, ** p < 0.01 vs Sham, ## p < 0.01 vs DPBS; && p < 0.01 vs ML264 + antagomiR NC; @@ p < 0.01 vs ML264 + Lv-NC). There were 10 mice in each group. Data were exhibited as mean ± SD from at least three independent experiments