Figures & data
Figure 1. Prakriti-specific growth differences in LCLs. (a) RealTime-Glo™ growth curves of LCLs. (b) Doubling times of the Kapha (K) to be significantly lower than Vata (V) and Pitta (P). Growth curves and box plots from biological and technical replicates [N = 3 (Vata and Kapha) and N = 2 (Pitta), n = 3, error bars denote ±SEM, unpaired t-test, ****p < 0.00001, ***p < 0.0001)]. (c) CFSE assay shows Kapha cell population dividing slower than Vata and Pitta (representative images of flow cytometry). (d) DI of Kapha is significantly lower than Vata and Pitta. Box plot from analysis of biological and technical replicates [N = 3 (Vata and Kapha) and N = 2 (Pitta), n = 3, error bars denote ±SEM, unpaired t-test, ***p < 0.0001)]
![Figure 1. Prakriti-specific growth differences in LCLs. (a) RealTime-Glo™ growth curves of LCLs. (b) Doubling times of the Kapha (K) to be significantly lower than Vata (V) and Pitta (P). Growth curves and box plots from biological and technical replicates [N = 3 (Vata and Kapha) and N = 2 (Pitta), n = 3, error bars denote ±SEM, unpaired t-test, ****p < 0.00001, ***p < 0.0001)]. (c) CFSE assay shows Kapha cell population dividing slower than Vata and Pitta (representative images of flow cytometry). (d) DI of Kapha is significantly lower than Vata and Pitta. Box plot from analysis of biological and technical replicates [N = 3 (Vata and Kapha) and N = 2 (Pitta), n = 3, error bars denote ±SEM, unpaired t-test, ***p < 0.0001)]](/cms/asset/f3e54fa9-4b6b-4e54-8530-59786d260dbe/kccy_a_1909884_f0001_oc.jpg)
Figure 2. Cell cycle marker proteins in Prakriti-specific LCLs. (a) Western blot (representative) for CDK2 pTyr15 (G2/S marker), histone H3 pSer10 (mitosis marker), and β-actin (loading control) at 24 hours of growth. (b) Western Blot quantitation showing a significant difference in CDK2 pTyr15 (G2/S marker) between Prakriti. (c) hHistone H3 pSer10 (mitosis marker) levels significantly differ between Prakriti [N = 3 (Vata and Kapha) and N = 2 (Pitta), n = 3, error bars denote ±SEM, unpaired t-test ****p < 0.00001, ***p < 0.0001, *p < 0.05]
![Figure 2. Cell cycle marker proteins in Prakriti-specific LCLs. (a) Western blot (representative) for CDK2 pTyr15 (G2/S marker), histone H3 pSer10 (mitosis marker), and β-actin (loading control) at 24 hours of growth. (b) Western Blot quantitation showing a significant difference in CDK2 pTyr15 (G2/S marker) between Prakriti. (c) hHistone H3 pSer10 (mitosis marker) levels significantly differ between Prakriti [N = 3 (Vata and Kapha) and N = 2 (Pitta), n = 3, error bars denote ±SEM, unpaired t-test ****p < 0.00001, ***p < 0.0001, *p < 0.05]](/cms/asset/be601326-7908-4597-9209-4dbdc6447b8c/kccy_a_1909884_f0002_oc.jpg)
Figure 3. Ki67 proliferation marker differs between Prakriti types. (a) Percent of proliferating cells in LCL populations at 12 hours (representative flow cytometry plots). (b) Ki67 staining over the course of 48 hours of growth. (c) Kapha has significantly lower Ki67-positive cells at 12 h compared to Vata and Pitta [N = 3 (Vata and Kapha) and N = 2 (Pitta), n = 3, error bars denote ±SEM, unpaired t-test ***p < 0.0001, **p < 0.001)
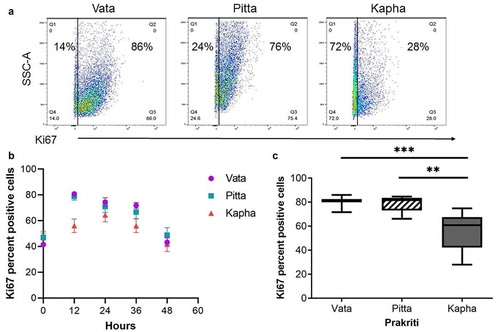
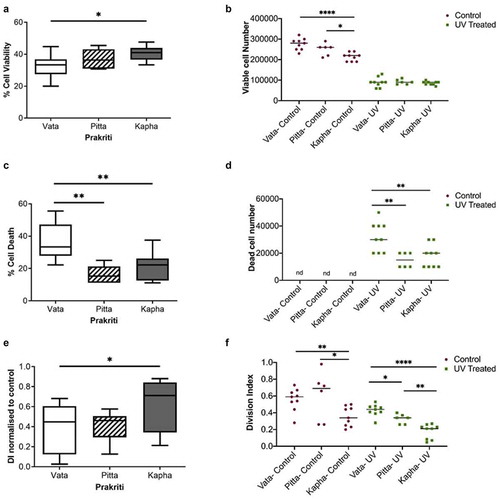
Figure 4. Effect of UV exposure on Prakriti-specific LCLs. (a) Percent cell viability, (b)viable cell number, (c) percent cell death, and (d) dead cell number of Prakriti-specific LCL types in response to UV stress. (e) Division index of Prakriti LCLs normalized to respective untreated controls. (f) Division index of control and UV exposed LCLs (N = 3 (Vata and Kapha) and N = 2 (Pitta), n = 3, error bars denote ±SEM, unpaired t-test ****p < 0.00001, **p < 0.001, *p < 0.05)