Figures & data
Figure 1. Screening of candidate genes for the prognostic model
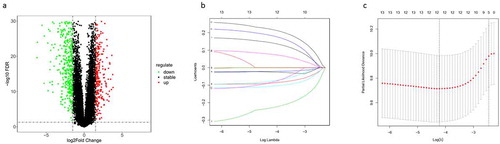
Table 1. Screening of survival-related genes via univariate COX regression
Table 2. The optimal multivariate COX regression model identified based on the AIC
Figure 2. The optimal 9 survival-related genes in multivariate COX regression analysis
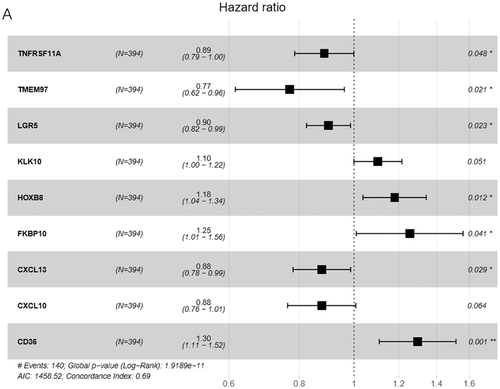
Figure 3. Analysis of the prognostic performance of the 9-gene model in the training dataset, testing dataset and TCGA-COAD independent dataset
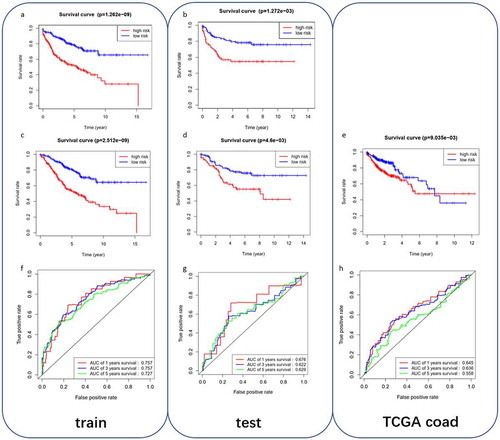
Figure 4. The expression of the 9 model genes, the riskscore distribution and survival status of patients in the training dataset and testing dataset
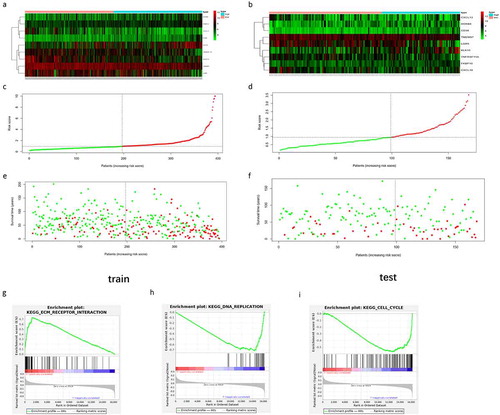
Table 3. Statistics of the basic clinical date of patients in the train dataset
Table 4. Statistics of the basic clinical data of patients in the test dataset
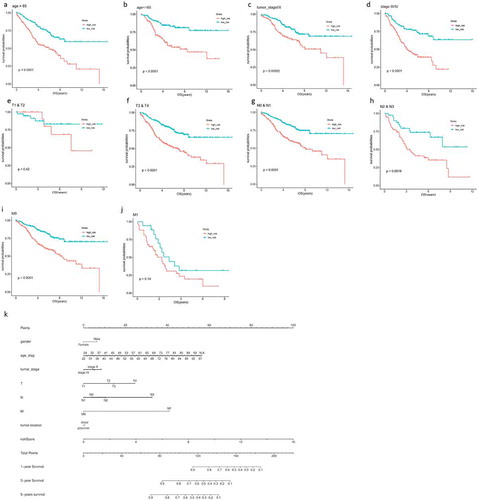
Figure 5. The prognostic performance of the 9-gene model in patients with different clinical subtypes in the training dataset and testing dataset