Figures & data
Figure 1. Expression of RELT in the ESCC tissues. (a) Expression levels of RELT in the normal esophageal tissues (n = 12) and the ESCC samples (n = 123) from the TCGA database were analyzed. (b) Survival analysis for patients with low- or high- expression levels of RELT, by the Kaplan-Meier method and the log-rank test. (c) The mRNA and (d) protein expressions of RELT in the paired ESCC and the corresponding normal tissues as determined by qRT-PCR and western blot. (e) Representative images of the IHC stained-normal esophageal and the IHC stained-ESCC tissues. (f) The mRNA and (g) protein expressions of RELT in the HEEC, ECA-109, KYSE140, TE-1, TE11, and TE-14 cell lines as detected by qRT-PCR and western blot
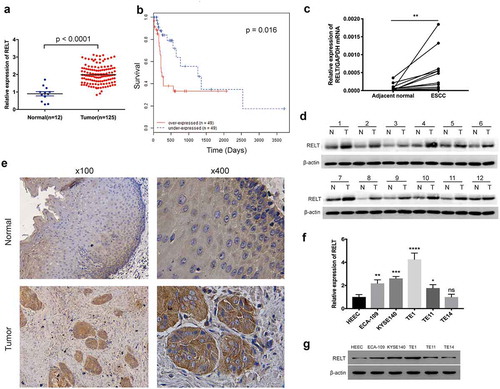
Figure 2. RELT enhanced cell viability of the ESCC cells. (a) RELT knock-down efficiency in the TE1 cells after the transfection with negative control (shNC) or with shRNAs (shRELT1–shRELT3) and (b) RELT overexpression efficiency in the TE14 cells after transfection with the negative control (vector) or pLVX-Puro-RELT (oeRELT) as evaluated by qRT-PCR. (c) RELT knock-down efficiency and (d) RELT overexpression efficiency as evaluated by western blotting. (e) The viability of the TE1 cells of shNC, shRELT-1, and shRELT-2 groups as examined by the CCK-8 assay. (f) The TE14 cells viability of vector group and the oeRELT group were examined by the CCK-8 assay
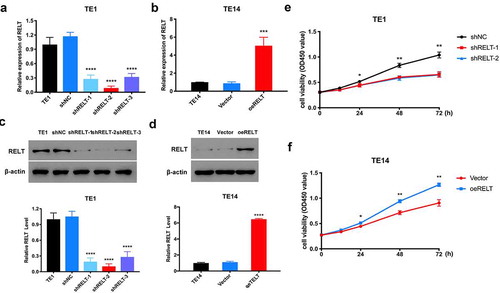
Figure 3. Effects of RELT on the cell cycle and cell apoptosis. (a, b) Cell cycle distribution and the effect of RELT on cell apoptosis in the T1 cells as evaluated with flow cytometry. (c, d) Cell cycle distribution and the effect of RELT on cell apoptosis in the T14 cells as determined by flow cytometry. (e, f) The levels of RELT, p27, caspase 3, and survivin as evaluated by western blotting
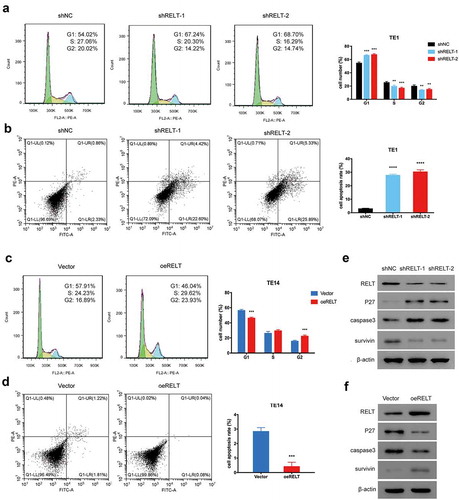
Figure 4. RELT up-regulation activated the NF-κB signaling pathway in the ESCC cells. (a) GSEA showed positive association between high expression of RELT and the NF-κB pathway. (b, c) Western blotting was performed to detect the level of NF-κB in the cytoplasm and the nucleus under the influence of RELT. PDTC, pyrrolidine dithiocarbamate. *, P < 0.05; **, P < 0.01; ***, P < 0.001;***, P< 0.0001
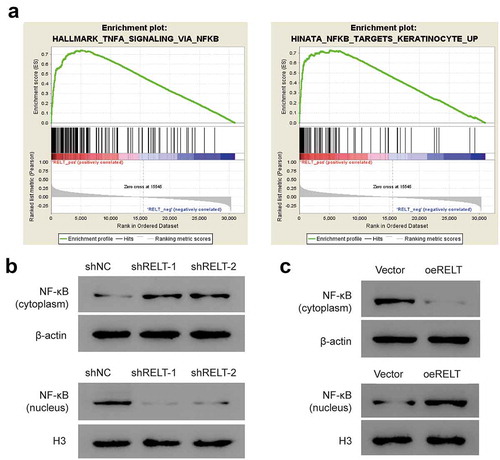
Figure 5. The NF-κB-pathway inhibitor PDTC reduced the RELT-mediated NF-κB-pathway activation and malignancy in the ESCC cells. (a) Cell viability, (b) cell cycle, and (c) cell apoptosis of the vector and the oeRELT group with or without PDTC treatment. (d) Western blotting was performed to detect the level of p27, caspase 3, survivin, and NF-κB in the vector and the oeRELT group with or without PDTC treatment
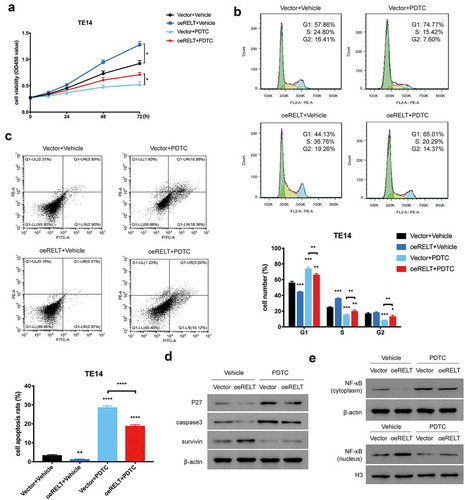
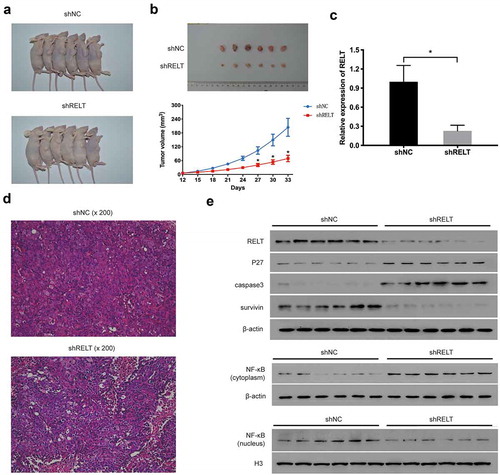
Figure 6. RELT knock-down inhibits tumor growth of ESCC in the xenograft tumor model. (a) Representative images of tumors after 33 days of implantation. (b) Tumor volume significantly decreased after 33 days of implantation in the shRELT group. (c) qRT-PCR performed to evaluate the levels of p27, caspase 3, survivin, the cytosolic NF-κB, and the nuclear NF-κB in two groups of mice. (d) Representative images of HE staining of xenograft tumors. (e) Western blotting was performed to evaluate the levels of p27, caspase 3, survivin, the cytosolic NF-κB, and the nuclear NF-κB in two groups of mice