Figures & data
Table 1. Primer sequence
Table 2. Antibody information
Table 3. Correlation between NORAD expression and clinicopathological characteristics of BC patients
Figure 1. NORAD is upregulated in BC; NORAD inhibition suppresses malignancy of BC cells and NORAD overexpression has opposite effect. A, NORAD expression in BC tissues and adjacent normal tissues detected using RT-qPCR (n = 108); B, NORAD expression in BC cell lines and human mammary cell line MCF10A detected using RT-qPCR; C, NORAD expression in MDA-MB-453 cells detected using RT-qPCR after transfection of NORAD-NC, sh-NORAD, or oe-NORAD; D, viability of MDA-MB-453 cells assessed using CCK-8 assay after transfection of NORAD-NC, sh-NORAD, or oe-NORAD; E, colony formation ability of MDA-MB-453 cells assessed using colony formation assay after transfection of NORAD-NC, sh-NORAD, or oe-NORAD; F, migration and invasion of MDA-MB-453 cells assessed using Transwell assay after transfection of NORAD-NC, sh-NORAD, or oe-NORAD (repetitions = 3); the measurement data conforming to the normal distribution were expressed as mean ± standard deviation, unpaired t-test was performed for comparisons between two groups and one-way ANOVA was used for comparisons among multiple groups, followed by Tukey’s post hoc test; A/B:* P < 0.05 vs the MCF10A cell line.C-F: * P < 0.05 vs the NORAD-NC group
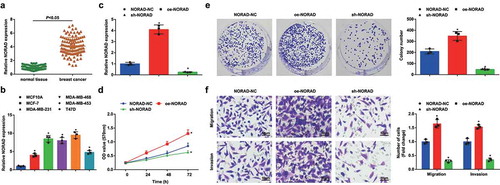
Figure 2. MiR-323a-3p upregulation inhibits malignancy of BC cells and miR-323a-3p downregulation has opposite effects. A, miR-323a-3p expression in BC tissues and adjacent normal tissues detected using RT-qPCR (n = 108); B, miR-323a-3p expression in BC cell lines and human mammary cell line MCF10A detected using RT-qPCR; C, miR-323a-3p expression in MDA-MB-453 cells detected using RT-qPCR after transfection of miR-323a-3p NC, miR-323a-3p mimic, or miR-323a-3p inhibitor; D, viability of MDA-MB-453 cells assessed using CCK-8 assay after transfection of miR-323a-3p NC, miR-323a-3p mimic, or miR-323a-3p inhibitor; E, colony formation ability of MDA-MB-453 cells assessed using colony formation assay after transfection of miR-323a-3p NC, miR-323a-3p mimic, or miR-323a-3p inhibitor; F, migration and invasion of MDA-MB-453 cells assessed using Transwell assay after transfection of miR-323a-3p NC, miR-323a-3p mimic, or miR-323a-3p inhibitor; repetitions = 3; the measurement data conforming to the normal distribution were expressed as mean ± standard deviation, unpaired t-test was performed for comparisons between two groups and one-way ANOVA was used for comparisons among multiple groups, followed by Tukey’s post hoc test; * P < 0.05 vs the MCF10A cell line; # P < 0.05 vs the miR-NC group
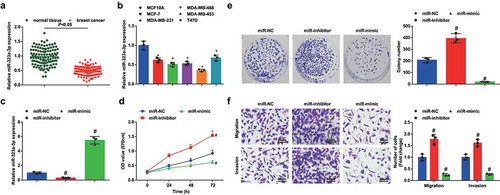
Figure 3. NORAD competitively binds to miR-323a-3p. A, binding sites between NORAD and miR-323a-3p obtained from Starbase; B, binding relationship between NORAD and miR-323a-3p confirmed using dual luciferase reporter gene assay; C, the endogenous binding of miR-323a-3p and NORAD assessed using RIP; D, the binding of NORAD-WT and miR-323a-3p assessed using RNA pull down assay; E, expression of miR-323a-3p in MDA-MB-453 cells assessed using RT-qPCR after transfection of NORAD-NC, sh-NORAD, or oe-NORAD; F, correlation between expression of miR-323a-3p and NORAD; G, NORAD and miR-323a-3p expression in the sh-NC + inhibitor-NC, sh-NORAD + inhibitor-NC and sh-NORAD + miR-inhibitor groups detected using RT-qPCR; H, cell viability of the sh-NC + inhibitor-NC, sh-NORAD + inhibitor-NC and sh-NORAD + miR-inhibitor groups detected using MTT assay; I, colony formation ability of the sh-NC + inhibitor-NC, sh-NORAD + inhibitor-NC and sh-NORAD + miR-inhibitor groups detected using colony formation assay; J, migration and invasion of the sh-NC + inhibitor-NC, sh-NORAD + inhibitor-NC and sh-NORAD + miR-inhibitor groups detected using Transwell assay; repetitions = 3; the measurement data conforming to the normal distribution were expressed as mean ± standard deviation and one-way ANOVA was used for comparisons among multiple groups, followed by Tukey’s post hoc test; * P < 0.05 vs the co-transfection group of NORAD-WT and miR-NC; # P < 0.05 vs the NORAD-NC group; $ P < 0.05 vs the sh-NC + inhibitor-NC group
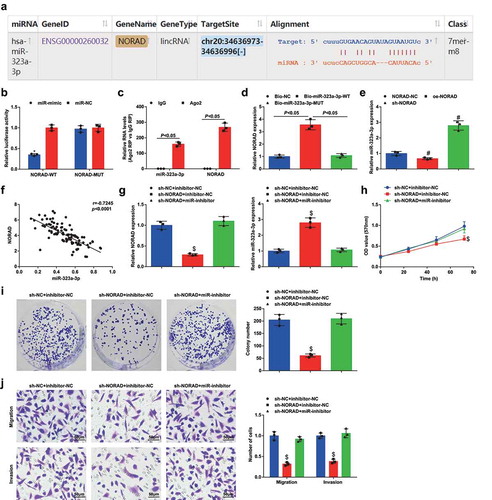
Figure 4. PUM1 is upregulated in BC and is targeted by miR-323a-3p. A&B, Targetscan (http://www.targetscan.org/) analyzed miR-323a-3p related target genes, and DIANA website (http://diana.imis.athena-innovation.gr/DianaTools/index.php?r=microT_CDS/index) screened the miTG score of the target gene was 0.98, and Starbase (http://starbase.sysu.edu.cn/) verified the binding site; C, PUM1 expression in BC tissues and adjacent normal tissues detected using RT-qPCR and Western blot (n = 108); D, PUM1 expression in BC cell lines and human mammary cell line MCF10A detected using RT-qPCR; E, targeting relationship between miR-323a-3p and PUM1 confirmed using dual luciferase reporter gene assay; F, targeting relationship between miR-323a-3p and PUM1 confirmed using RNA pull-down assay; G, correlation between expression of miR-323a-3p and PUM1; H, correlation between expression of NORAD and PUM1; repetitions = 3; the measurement data conforming to the normal distribution were expressed as mean ± standard deviation and one-way ANOVA was used for comparisons among multiple groups, followed by Tukey’s post hoc test; * P < 0.05 vs the MCF10A cell line; # P < 0.05 vs the co-transfection group of PUM1-WT and miR-NC; $ P < 0.05 vs the Bio-NC group
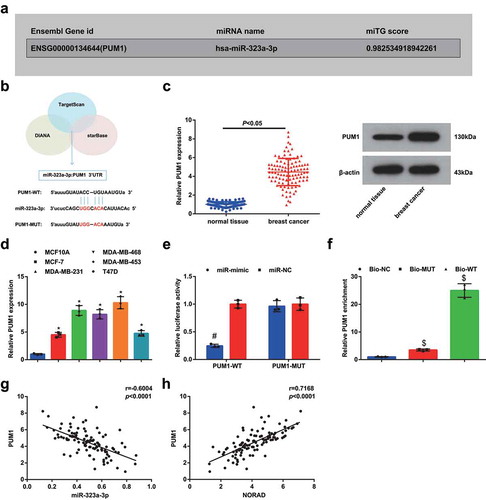
Figure 5. NORAD/miR-323a-3p/PUM1/eIF2 functions through an axial relationship. A, PUM1 expression in MDA-MB-453 cells detected using RT-qPCR after transfection of NORAD-NC, sh-NORAD, or oe-NORAD; B, PUM1 expression in MDA-MB-453 cells detected using RT-qPCR after transfection of miR-323a-3p NC, miR-323a-3p mimic, or miR-323a-3p inhibitor; C, PUM1 expression in the NORAD-NC + miR-NC, sh-NORAD + miR-NC and sh-NORAD + miR-inhibitor expression detected using RT-qPCR; D, protein contents of PUM1, p-PERK, p-EIF2 and ATF4 detected using Western blot analysis; E, the absorbance at 570 nm at different time points (0, 24, 48, 72 h) detected using MTT; F, the number of colonies detected using colony formation experiment; G, the migration and invasion detected using Transwell method. repetitions = 3; the measurement data conforming to the normal distribution were expressed as mean ± standard deviation and one-way ANOVA was used for comparisons among multiple groups, followed by Tukey’s post hoc test; * P < 0.05 vs the NORAD-NC group; # P < 0.05 vs the miR-323a-3p-NC group; $ P < 0.05 vs the NORAD-NC + miR-323a-3p-NC group; & P < 0.05 vs the oe-NC + si-NC group; ^ P < 0.05 vs the oe-NC + si-PUMI group
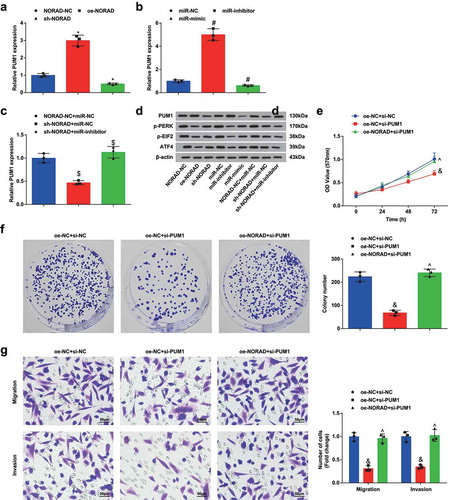
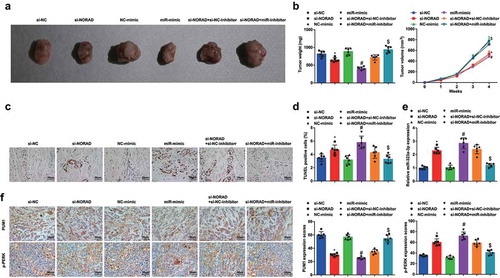
Figure 6. NORAD silencing or miR-323a-3p elevation represses the tumor growth in BC nude mice. A, representative images of xenografts resected from nude mice injected with transfected MDA-MB-453 cells; B, weight and volume of xenografts resected from nude mice injected with transfected MDA-MB-453 cells; C, representative images of TUNEL staining of xenografts resected from nude mice injected with transfected MDA-MB-453 cells; D, ratio of TUNLE positive cells in xenografts resected from nude mice injected with transfected MDA-MB-453 cells; E, miR-323a-3p in xenografts resected from nude mice injected with transfected MDA-MB-453 cells; F, PUM1 and p-PERK expression in xenografts resected from nude mice injected with transfected MDA-MB-453 cells was detected using immunohistochemical staining (200 ×); n = 6; the measurement data conforming to the normal distribution were expressed as mean ± standard deviation and one-way ANOVA was used for comparisons among multiple groups, followed by Tukey’s post hoc test; * P < 0.05 vs the si-NC group; # P < 0.05 vs the NC-mimic group; $ P < 0.05 vs the si-NORAD + NC-inhibitor group