Figures & data
Table 1. Primer sequence
Figure 1. Isoflurane alleviates HIRI in rat liver tissues. (a) Levels of 1 L-1β, IL-6, and TNF-α were determined by ELISA (n = 12); (b) activities of AST, ALT, and LDH were evaluated using a biochemical analyzer (n = 12); (c) activities of SOD and MDA in rat liver tissues (n = 12); in (a–c) * P < 0.05 vs. the sham group, # P < 0.05 vs. the IR group; the measurement data conforming to the normal distribution were expressed as mean ± standard deviation, one-way ANOVA was used for comparisons among multiple groups, and Tukey’s post hoc test was used for pairwise comparisons after one-way ANOVA
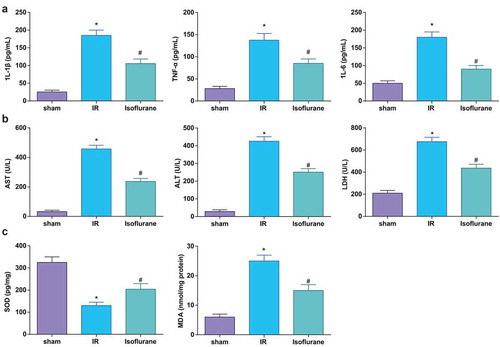
Figure 2. Isoflurane alleviates HIRI in rat liver tissues. (a) Pathological changes in rat liver tissue observed using HE staining (n = 12); (b) apoptosis in rat liver tissue detected by TUNEL staining; (c) Caspase-3 expression in rat liver tissues was assessed by immunohistochemical staining (n = 12); (d) Bax protein expression was detected by Western blot analysis (n = 12); in (a–d), * P < 0.05 vs. the sham group, # P < 0.05 vs. the IR group; the measurement data conforming to the normal distribution were expressed as mean ± standard deviation, one-way ANOVA was used for comparisons among multiple groups, and Tukey’s post hoc test was used for pairwise comparisons after one-way ANOVA
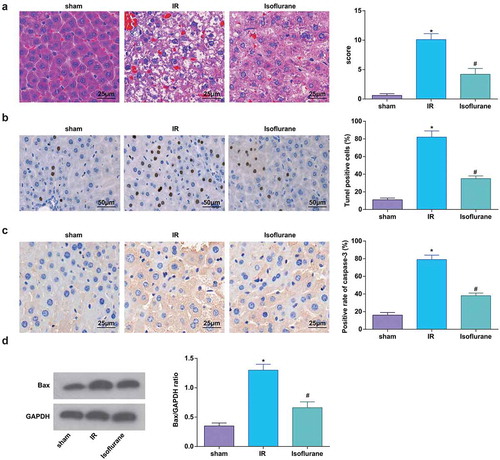
Figure 3. Elevated miR-9-3p ameliorates HIRI-induced changes in inflammation, oxidative stress, and transaminases in HIRI rat liver tissues. (a) Levels of 1 L-1β, IL-6, and TNF-α were determined by ELISA (n = 12); (b) activities of AST, ALT, and LDH were evaluated using a biochemical analyzer (n = 12); (c) activities of SOD and MDA in rat liver tissues (n = 12); in (a–c) * P < 0.05 vs. the agomir-NC group; the measurement data conforming to the normal distribution were expressed as mean ± standard deviation, one-way ANOVA was used for comparisons among multiple groups, and Tukey’s post hoc test was used for pairwise comparisons after one-way ANOVA
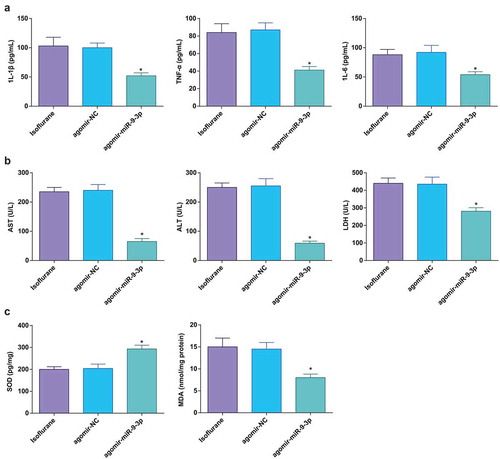
Figure 4. Elevated miR-9-3p relives pathological changes and hepatocyte apoptosis in HIRI rat liver tissues. (a) Pathological changes in rat liver tissue observed using HE staining (n = 12); (b) apoptosis in rat liver tissue detected by TUNEL staining (n = 12); (c) Caspase-3 expression in rat liver tissues was assessed by immunohistochemical staining (n = 12); (d) Bax protein expression was detected by Western blot analysis (n = 12); in (a–d), * P < 0.05 vs. the agomir-NC group; the measurement data conforming to the normal distribution were expressed as mean ± standard deviation, one-way ANOVA was used for comparisons among multiple groups, and Tukey’s post hoc test was used for pairwise comparisons after one-way ANOVA
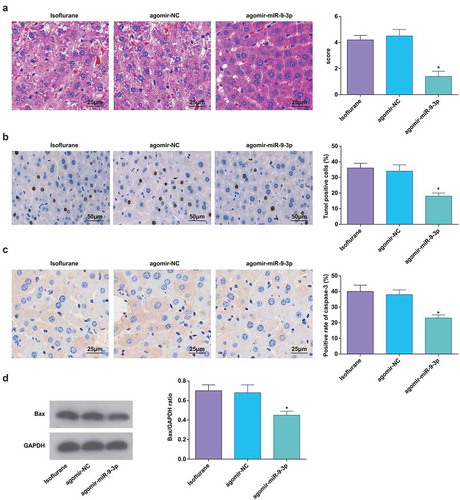
Figure 5. MiR-9-3p inhibition aggravates HIRI-induced changes in inflammation, oxidative stress, and transaminases in HIRI rat liver tissues. (a) Levels of 1 L-1β, IL-6, and TNF-α were determined by ELISA (n = 12); (b) activities of AST, ALT, and LDH were evaluated using a biochemical analyzer (n = 12); (c) activities of SOD and MDA in rat liver tissues (n = 12); in (a–c), * P < 0.05 vs. the antagomir-NC group; the measurement data conforming to the normal distribution were expressed as mean ± standard deviation, one-way ANOVA was used for comparisons among multiple groups, and Tukey’s post hoc test was used for pairwise comparisons after one-way ANOVA
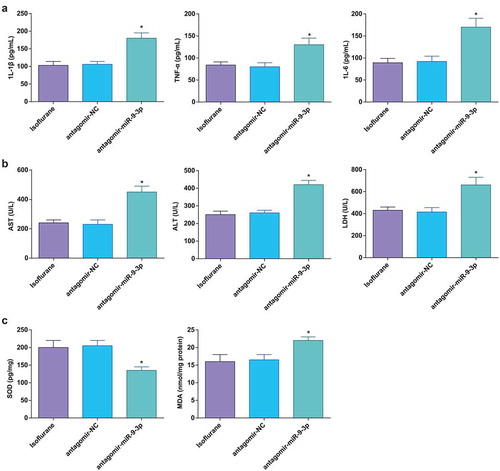
Figure 6. MiR-9-3p inhibition promotes pathological changes and hepatocyte apoptosis in HIRI rat liver tissues. (a) Pathological changes in rat liver tissue observed using HE staining (n = 12); (b) apoptosis in rat liver tissue detected by TUNEL staining (n = 12); (c) Caspase-3 expression in rat liver tissues was assessed by immunohistochemical staining (n = 12); (d) Bax protein expression was detected by Western blot analysis (n = 12); in (a–d) * P < 0.05 vs. the antagomir-NC group; the measurement data conforming to the normal distribution were expressed as mean ± standard deviation, one-way ANOVA was used for comparisons among multiple groups, and Tukey’s post hoc test was used for pairwise comparisons after one-way ANOVA
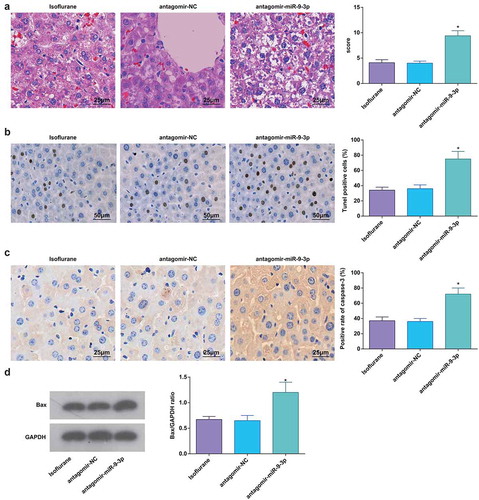
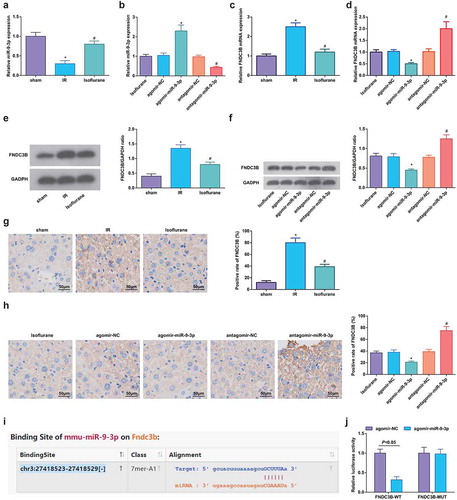
Figure 7. Isoflurane upregulates miR-9-3p and FNDC3B is targeted by miR-9-3p. (a–d) MiR-9-3p and FNDC3B expression was assessed by RT-qPCR (n = 12); (e/f) Protein expression of FNDC3B in rat liver tissues was determined by Western blot analysis (n = 12); (g/h), FNDC3B level in rat liver tissues was detected by immunohistochemical staining (n = 12); (i) binding site of miR-9-3p and FNDC3B was predicted at Targetscan (N = 3); (j) regulatory relationship between miR-9-3p and FNDC3B was confirmed using dual luciferase reporter gene assay; in (a, c, e, g), * P < 0.05 vs. the sham group, # P < 0.05 vs. the IR group; in (b, d, f, h), * P < 0.05 vs. the agomir-NC group, # P < 0.05 vs. the antagomir-NC group; the measurement data conforming to the normal distribution were expressed as mean ± standard deviation, unpaired t-test was performed for comparisons between two groups, one-way ANOVA was used for comparisons among multiple groups, and Tukey’s post hoc test was used for pairwise comparisons after one-way ANOVA