Figures & data
Figure 1. Precocious centriole separation in CEP215-deleted cells during mitosis (a) The CEP215- or pericentrin (PCNT)-deleted HeLa cells were arrested at prometaphase with STLC and subjected to coimmunostaining analysis with centrin-2 (CETN2; green) and CEP135 (red) antibodies. Scale bar, 10 μm. (b) Engaged centrioles were determined with 2:1 ratio of the CENT2 and CEP135 signals (Type I). Centriole separation was determined with 1:1 ratio (Type III). Type II indicates that the centrioles separated but remained within the same centrosome. (c) The number of cells with three types of centrioles were counted. (d) The CEP215-deleted cells were stably rescued with ectopic FLAG-CEP215 (WT, ΔC, WT + PACT and ΔC + PACT). The cells were arrested at prometaphase and subjected to coimmunostaining analysis with the CETN2 (green) and CEP135 (red) antibodies. Scale bar, 10 μm. (e) The number of cells with three types of centrioles were counted. (c, e) Greater than 30 cells per group were analyzed in three independent experiments. Values are means and SEM. The statistical significance was analyzed using t-test compared to the control within the same group (*, P < 0.05)
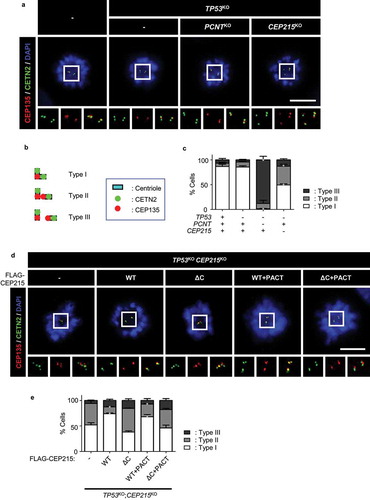
Figure 2. Generation of the TP53;PCNT;CEP215-deleted cells (a) The TP53, PCNT, and CEP215 genes were deleted in HeLa cells using the CRISPR/Cas9 method. Endogenous PCNT was deleted in the presence of the ectopic DD-PCNT gene whose expression is induced by doxycycline (Dox) and shield1 (SHLD1). The deletions were confirmed via immunoblotting analysis with antibodies specific to PCNT, CEP215, and GAPDH. (b) The KO cells were coimmunostained with antibodies specific to CETN2 (green), PCNT (red), and CEP215 (red). Nuclei were stained with DAPI (blue). Scale bar, 10 μm. (c, d) Relative intensities of the centrosomal PCNT (c) and CEP215 (d) signals were determined. Greater than 30 cells per group were analyzed in three independent experiments. Relative intensities of the centrosome signals are presented with the box and whisker plots. The statistical significance was analyzed using one-way ANOVA and indicated using lower case alphabets (P < 0.05)
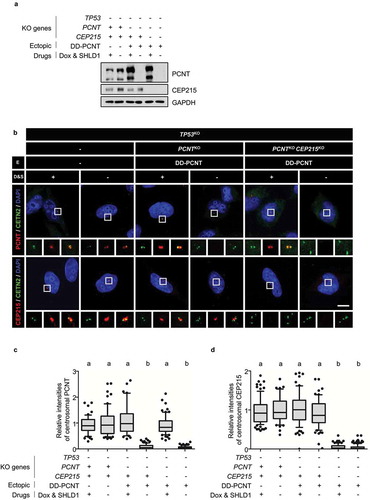
Figure 3. Precocious centriole separation and amplification of the triple KO cells during M phase (a) Timeline for preparation of prometaphase cells. The KO cells were treated with thymidine for 24 h followed by STLC for 10 h. (b) Immunoblot analyses were performed with antibodies specific to PCNT, CEP215, cyclin B1, and GAPDH. (c) The cells were subjected to coimmunostaining analysis with the CETN2 (green) and CEP135 (red) antibodies. Nuclei were stained with DAPI (blue). Scale bar, 10 μm. (d) The number of cells with separated centrioles were counted. (e) The number of centrioles per cell were counted. (f) Timeline for the preparation of naturally dividing prometaphase cells. The triple KO cells were treated with thymidine for 24 h, followed by RO3306 for 8 h, and released for 20 min. (g) The cells were subjected to coimmunostaining analysis with the CETN2 (green) and CEP135 (red) antibodies. Nuclei were stained with DAPI (blue). Scale bar, 10 μm. (h) the number of cells with separated centrioles were counted. (i) The number of centrioles per cell were counted (D, E, H, I). Greater than 30 cells per group were analyzed in three independent experiments. Values are means and SEM. The statistical significance was analyzed using one-way ANOVA (d, h) and t-test compared to the control within the same group (e, i). (P < 0.05)
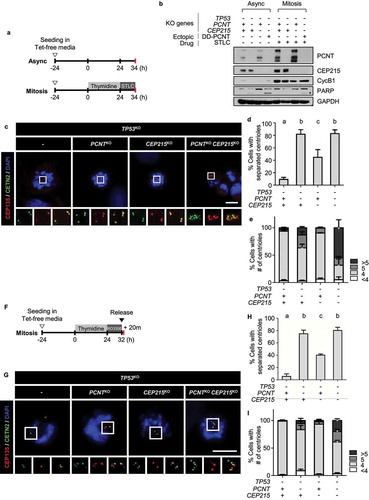
Figure 4. Centriole numbers throughout the cell cycle in the triple KO cells (a) Timeline for preparation of synchronous interphase cells. Cells were treated with doxycycline for 24 h to induce ectopic PLK4 expression, washed out and cultured for another 24 h. After the mitotic shake-off, the cells were cultured for up to 24 h. (b) The PLK4-overexpressing and KO cells were subjected to coimmunostaining analysis with the CETN2 (green) and CEP152 (red) antibodies. Scale bar, 2 μm. (c) The number of CETN2 dots were counted at indicated time points. (d) After the mitotic shake-off, the PLK4-overexpressing and KO cells were cultured in the presence of centrinone for 2 h and 17 h, and immunostained with the CETN2 antibody. The number of CETN2 dots per cell were counted. (c, d) Greater than 30 cells per group were analyzed in three independent experiments. Values are means and SEM. The statistical significance was analyzed using t-test between the indicated groups (n.s., not significant; *, P < 0.05)
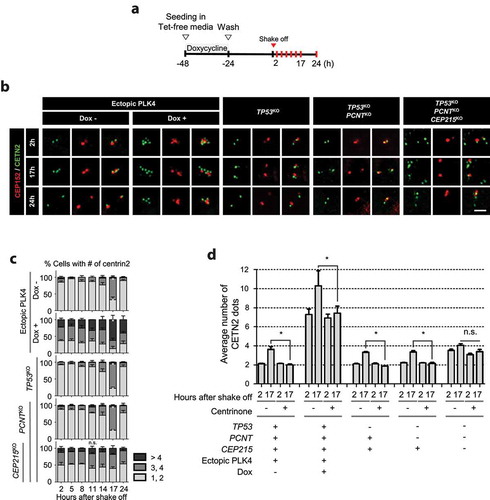
Figure 5. Centriole assembly during M phase in the triple KO cells (a) CETN2-Dendra2 was stably expressed in the triple KO cells. The cells were treated with thymidine for 24 h followed by STLC for 7 h, and light-activated. The CETN2-Dendra2 signals were observed for up to 2 h after the activation. Light activation makes CETN2-Dendra2 detected with both 448 and 594 nm fluorescent light (green and red). Scale bar, 4.42 μm. (b) The triple KO cells stably expressing CETN2-Dendra2 were treated with thymidine for 24 h, followed by RO3306 for 8 h, and light-activated. Thirty minutes after the release, mitotic cells were collected by the shake-off method, and cultured for 3 h. (c) We recorded the fluorescent signals of the cells, and fixed them for coimmunostaining analysis with antibodies specific to CETN2 and CEP152. Scale bar, 10 μm. (d) The number of cells with green-only centrioles were counted. (e) The number of cells with CEP152-negative centrioles were counted. (d, e) Greater than 20 cells per group were analyzed in three independent experiments. The statistical significance was analyzed using t-test (* P < 0.05). (f) The PLK4-overexpressing and KO cells were treated with STLC for 10 h and subjected to coimmunostaining analysis with the CETN2 (green) and SAS6 (red) antibodies. Scale bar, 10 μm. (g) The number of SAS6-positive (orange) and -negative (gray) CETN2 dots were counted. Greater than 30 cells per group were analyzed in three independent experiments. Values are means and SEM
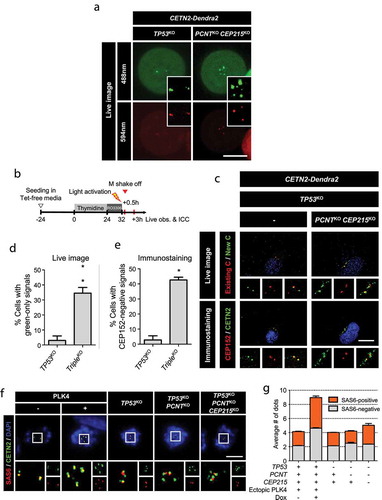
Figure 6. Intactness of the centrioles in the triple KO cells (a) Mitotic cells were collected with the mitotic shake-off method and cultured for up to 24 h. The number of CEP152 dots was counted at indicated time points. The statistical significance was analyzed using the t-test compared to the 2 h values within the same groups (n.s., not significant; * P < 0.05). (b) The G1 phase cells were coimmunostained with antibodies specific to CEP295, CEP192, CEP135 and γ-tubulin, along with CETN2 and CEP152. The number of centrioles with CEP152 and the indicated protein signals were counted. (c) The cells were arrested at prometaphase and subjected to coimmunostaining analysis with the CETN2 (green) and CEP295 or CEP152 (red) antibodies. Scale bar, 2 μm. (d, e) The numbers of CEP295 and CEP152 signals were counted in the cells. The statistical significance was analyzed using t-test compared to the control within the same group (* P < 0.05). (A, B, D, E) Greater than 30 cells per group were analyzed in three independent experiments. Values are means and SEM
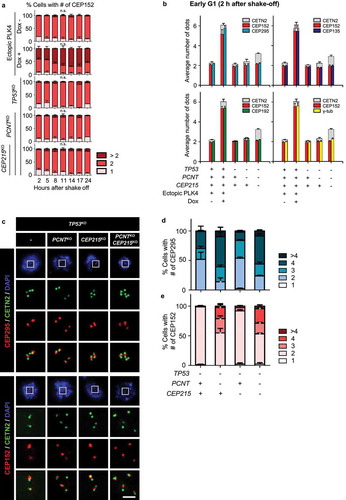
Figure 7. Spindle defects in the triple KO cells (a) The KO cells at interphase and mitosis were subjected to coimmunostaining analysis with antibodies specific to CEP192 (green), γ-tubulin (red) and CETN2 (cyan). Scale bar, 10 μm. (b) The number of CEP192 and γ-tubulin signals were counted in cells at interphase (i) and mitosis (m). (c) The PLK4-overexpressing and triple KO cells at G1 phase were subjected to microtubule regrowth assays. The cells were coimmunostained with antibodies specific to CETN2 (green) and α-tubulin (red). Scale bar, 2 μm. (d) The number of CETN2 dots with microtubule asters were counted. (e) The PLK4-overexpressing and KO cells at mitosis were subjected to coimmunostaining analysis with the CETN2 (green) and α-tubulin (red) antibodies. DNA was stained with DAPI (blue). Representative spindle abnormalities were shown. Scale bar, 10 μm. (f) Mitotic cells with abnormal spindles were counted. (B, D, F) Greater than 30 cells per group were analyzed in three independent experiments. Values are means and SEM. The statistical significance was analyzed using t-test (*, P < 0.05)
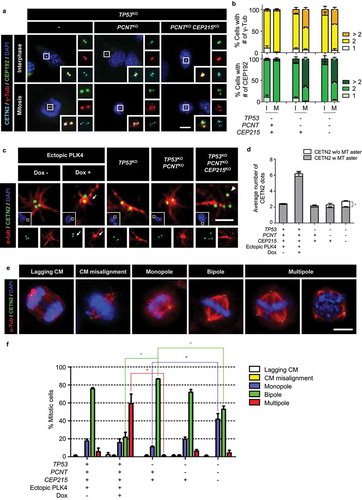
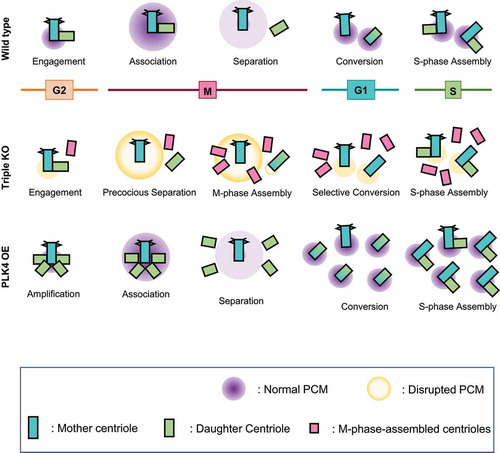
Figure 8. Model for the generation of supernumerary centrioles at M phase. After entering the M phase, the daughter centrioles readily disengage from mother centrioles, but remain associated within the same mitotic centrosomes. Daughter centrioles eventually separate from the mother centrioles after PCM is disintegrated at the end of mitosis. Simultaneous deletion of PCNT and CEP215 makes mitotic PCM disorganized, resulting in the precocious separation of the centrioles at M phase. Since the centrioles are liberated from the inhibitory environment against centriole assembly, they start to function as templates for centriole assembly even in M phase. However, these M-phase-assembled centrioles may not organize microtubules, nor function as templates for centriole assembly in the subsequent S phase. In contrast, PLK4 overexpression generates supernumerary centrioles at S phase, most of which may function as templates for centriole assembly in the subsequent S phase