Figures & data
Table 1. Primer sequence
Figure 1. PROX1-AS1 and SOX2 are upregulated whereas miR-519d-3p is downregulated in RB tissues. A, PROX1-AS1 expression in RB tissues and normal retina tissues; B, miR-519d-3p expression in RB tissues and normal retina tissues; C, SOX2 expression in RB tissues and normal retina tissues; n = 60; the measurement data were expressed as mean ± standard deviation and the unpaired t-test was performed for comparisons between two groups
Figure 2. PROX1-AS1 and SOX2 are upregulated whereas miR-519d-3p is downregulated in RB cells. A, PROX1-AS1 expression in each cell line; B, miR-519d-3p expression in each cell line; C, SOX2 mRNA expression in each cell line; D, SOX2 protein expression in each cell line * P < 0.05 vs. the RPE cells; N = 3; the measurement data were expressed as mean ± standard deviation, one-way ANOVA was used for comparisons among multiple groups and Tukey’s post hoc test was used for pairwise comparisons after one-way ANOVA
Figure 3. PROX1-AS1 knockdown represses drug resistance of RB cells. A, RI of SO-Rb50/CBP and SO-Rb50/DDP under treatment of different concentrations of drug; B, PROX1-AS1 expression in SO-Rb50, SO-Rb50/CBP and SO-Rb50/DDP cells; C, PROX1-AS1 expression in SO-Rb50, SO-Rb50/CBP and SO-Rb50/DDP cells after transfection of si-PROX1-AS1; D-E, RI of drug-resistant RB cells under treatment of different concentrations of drug after transfection of si-PROX1-AS1; F-G, the survival curve of drug-resistant RB cell lines; H-K, invasion and migration of drug-resistant RB cells detected using Transwell assay; L-M, colony formation ability of drug-resistant RB cells detected using colony formation assay; N, apoptosis of drug-resistant RB cells detected using flow cytometry; # P < 0.05 vs. the SO-Rb50 cells, ^ P < 0.05 vs. the si-PROX1-AS1 NC group, * P < 0.05 vs. the blank group; N = 3; the measurement data were expressed as mean ± standard deviation, unpaired t-test was performed for comparisons between two groups, one-way ANOVA was used for comparisons among multiple groups and Tukey’s post hoc test was used for pairwise comparisons after one-way ANOVA
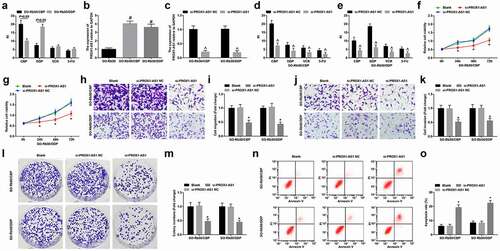
Figure 4. MiR-519d-3p represses drug resistance of RB cells. A, miR-519d-3p expression in parent and drug-resistant cells; B, miR-519d-3p expression in drug-resistant cells detected using RT-qPCR; C-D, RI of drug-resistant RB cells under treatment of different concentrations of drug; E-F, viability of drug-resistant cells detected using MTT assay; G-J, invasion and migration of drug-resistant cells detected using Transwell assay; K-L, colony formation ability of drug-resistant cells detected using colony formation assay; M-N, apoptosis of drug-resistant cells detected using flow cytometry; # P < 0.05 vs the SO-Rb50 cells, ^ P < 0.05 vs the mimic NC group, * P < 0.05 vs the blank cells; N = 3; the measurement data were expressed as mean ± standard deviation, unpaired t-test was performed for comparisons between two groups, one-way ANOVA was used for comparisons among multiple groups and Tukey’s post hoc test was used for pairwise comparisons after one-way ANOVA
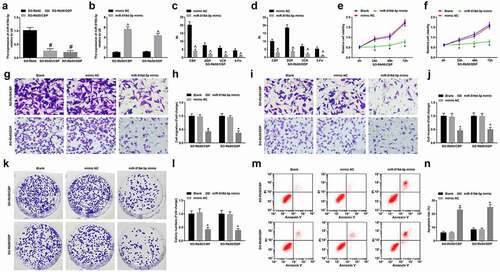
Figure 5. MiR-519d-3p inhibition reverses the effect of PROX1-AS1 knockdown on RB cells. A-B, viability of drug-resistant cells detected using MTT assay; C-F, invasion and migration of drug-resistant cells detected using Transwell assay; G-H, colony formation ability of drug-resistant cells detected using colony formation assay; I-J, apoptosis of drug-resistant cells detected using flow cytometry; * P < 0.05 vs. the si-PROX1-AS1 NC + inhibitor NC group, # P < 0.05 vs. the si-PROX1-AS1 + inhibitor NC group; N = 3; the measurement data were expressed as mean ± standard deviation, one-way ANOVA was used for comparisons among multiple groups and Tukey’s post hoc test was used for pairwise comparisons after one-way ANOVA
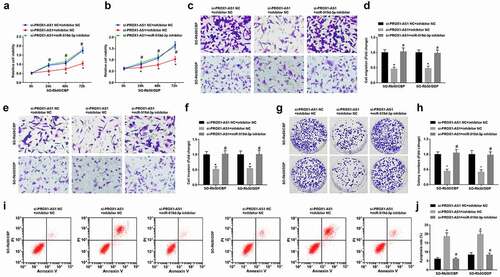
Figure 6. PROX1-AS1 binds to miR-519d-3p. A, subcellular localization of PROX1-AS1 predicted at a bioinformatic website; B, subcellular localization of PROX1-AS1 confirmed using FISH assay; C, binding sites between PROX1-AS1 and miR-519d-3p predicted at a bioinformatic website; D, binding relationship between PROX1-AS1 and miR-519d-3p confirmed using dual luciferase reporter gene assay; E/F, binding relationship between PROX1-AS1 and miR-519d-3p confirmed using RNA pull-down assay; N = 3; the measurement data were expressed as mean ± standard deviation, unpaired t-test was performed for comparisons between two groups, one-way ANOVA was used for comparisons among multiple groups and Tukey’s post hoc test was used for pairwise comparisons after one-way ANOVA
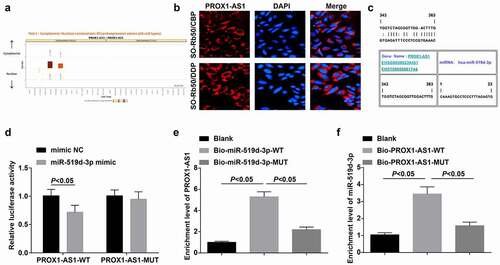
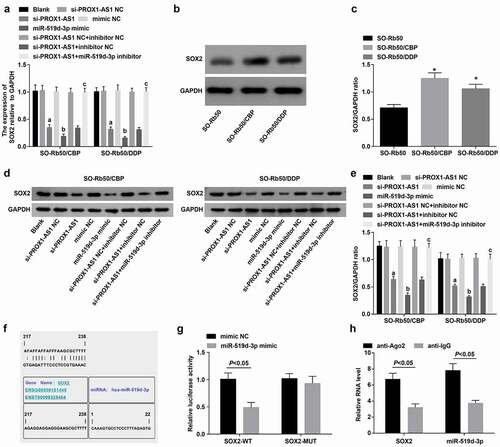
Figure 7. SOX2 is high-expressed in drug-resistant RB cells and miR-519d-3p targets SOX2. A-C, mRNA and protein expression of SOX2 in parent and drug-resistant cells; D-E, mRNA and protein expression of SOX2 in each drug-resistant cell lines; F, binding sites between miR-519d-3p and SOX2 predicted at a bioinformatic website; G, targeting relationship between miR-519d-3p and SOX2 confirmed using dual luciferase reporter gene assay; H, the binding relationship between miR-519d-3p and SOX2 was validated by RIP assay. * P < 0.05 vs. the SO-Rb50 cells, a P < 0.05 vs. the si-PROX1-AS1 NC group, b P < 0.05 vs the mimic NC group, c P < 0.05 vs. the si-PROX1-AS1 + inhibitor NC group; N = 3; the measurement data were expressed as mean ± standard deviation, unpaired t-test was performed for comparisons between two groups, one-way ANOVA was used for comparisons among multiple groups and Tukey’s post hoc test was used for pairwise comparisons after one-way ANOVA