Figures & data
Figure 1. MYBL2 expression in human cancers. (a) MYBL2 differential expression between human cancers and normal tissues in the Oncomine database. (b) MYBL2 expression levels in different cancers from the TCGA database analyzed by TIMER2.0. (c) The correlation between MYBL2 expression and the stage of cancers from the TCGA database analyzed by TISBID. (d) The protein expression level of MYBL2 in different cancer types from the Human Protein Atlas
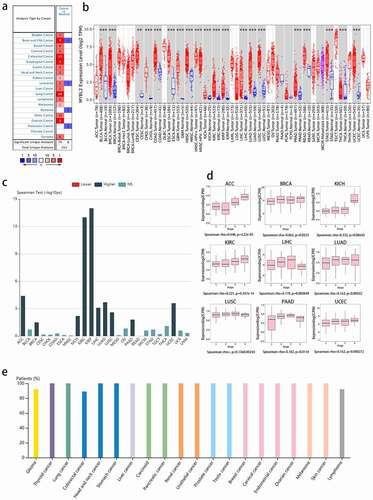
Figure 2. Correlation between MYBL2 expression and the prognosis of cancer patients in the TCGA. The survival maps and survival curves showing significant differences in overall survival (a) and disease-free survival (b) for different cancer types from the TCGA analyzed by GEPIA
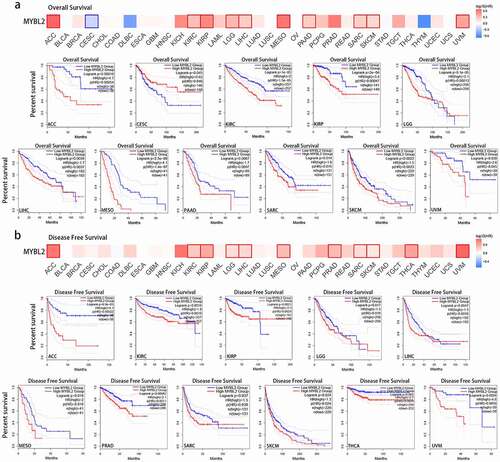
Figure 3. The alteration analysis of MYBL2 by cBioPortal. (a) The correlation between MYBL2 expression and CNA types. (b) The correlation between MYBL2 expression and mutation types. (c) The frequency of MYBL2 gene alterations in different cancer types from the TCGA database. (d) The mutation site is displayed
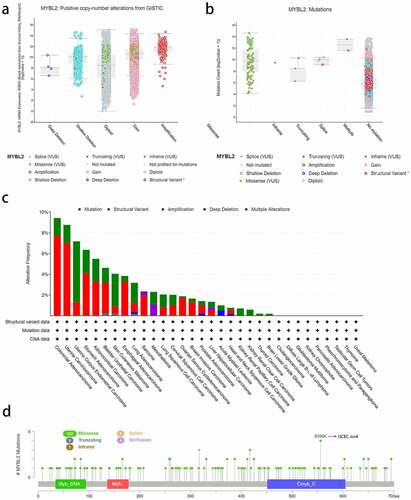
Figure 4. Methylation analysis of MYBL2 in different tumors. (a) Image of the chromosomal distribution of methylation probes associated with MYBL2. (b) The difference in the promoter methylation level of MYBL2 in cancers and normal tissues, which was statistically significant; n was greater than 20. (c) Analysis of CpG-aggregated methylation of MYBL2 in human cancers with SMART
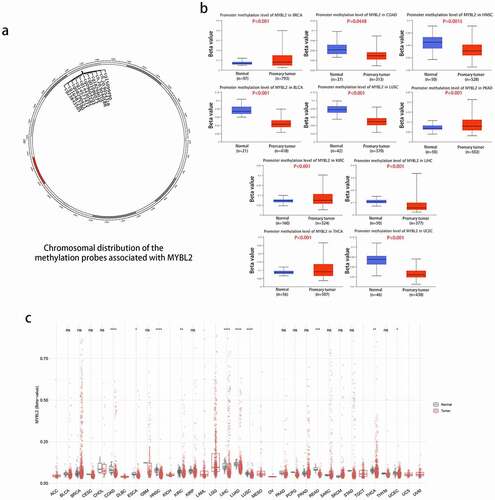
Figure 5. Correlation analysis between MYBL2 expression and cancer-related immune cells. The potential correlation between the expression level of the MYBL2 gene and the infiltration level of cancer-associated fibroblasts based on different algorithms across all types of cancer in the TCGA analyzed by TIMER2.0. Correlation heat maps (a) and some of the correlation curves (b). (c) Heat maps showing the correlations between MYBL2 expression level and the immune checkpoint-related genes SIGLEC15, IDO1, CD274, HAVCR2, PDCD1, CTLA4, LAG3 and PDCD1LG2 plotted with the R language
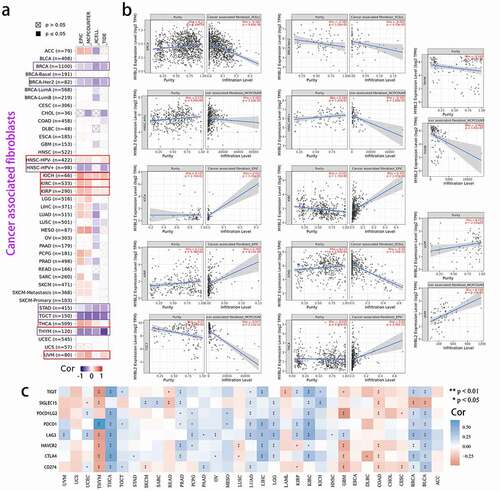
Figure 6. The related genes and functional enrichment analysis of MYBL2. (a) Protein-protein interaction networks of the available experimentally determined MYBL2-interacting proteins from STRING. We collected the top 100 related genes from GEPIA and obtained the top 5 to plot the correlation curves (b) and correlation heat maps (c). We removed duplicated genes from the two datasets and performed GO analysis (including biological process (d), cellular component (e) and molecular function (f) analysis) and KEGG pathway (g) analysis
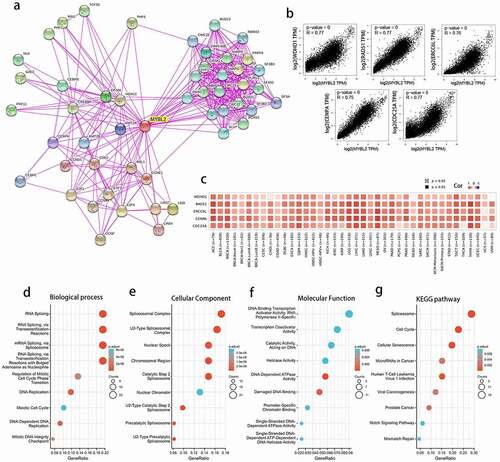
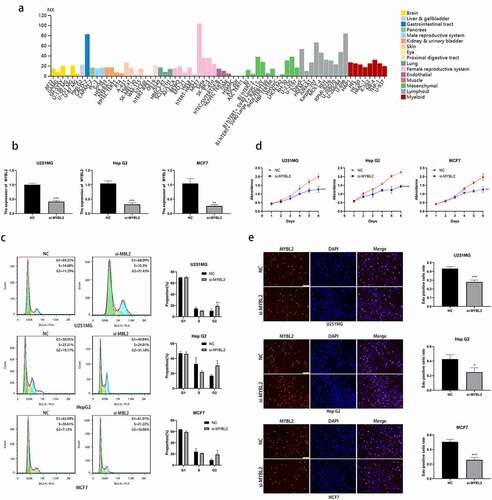
Figure 7. Effect of MYBL2 on cancer cell cycle and proliferation in vitro experiment. (a) The expression level of MYBL2 in different cell lines from HPA database. (b) The U251MG, HepG2 and MCF7 cell lines were transfected with siRNA of MYBL2. Reverse transcription-quantitative PCR was performed to examine the MYBL2 expression level with control and treatment. (c) Cell cycle profile of control and treatment groups of U251MG, HepG2 and MCF7 cells were analyzed by flow cytometry. The histogram shows the proportion of cell percentage. (d) The effect of MYBL2 on proliferation was examined by Cell Counting Kit-8 assay in U251MG, HepG2 and MCF7 cell lines. (e) The effect of MYBL2 on proliferation was examined by 5 – ethynyl – 2 ‘- deoxyuridine (EdU) assay in U251MG, HepG2 and MCF7 cell lines