Figures & data
Table 1. The table shows the gene symbols for and the locations of their TSSs from the nearest CGGBP1-regulated CTCF-binding sites. These combinations were selected based on the presence of a CGGBP1-regulated CTCF-binding site between their alternative TSSs
Figure 1. RNA levels and RNA Polymerase 2 occupancy at the TSSs of selected genes tabulated in . A: The RNA levels at the TSSs of the genes are calculated by the double delta Ct method. Beta-actin (ACTB) has been used as a quantitation control in all PCRs. The Y-axis shows the ddCt values on a log2 scale. The location of the TSSs relative to the nearest CGGBP1-regulated CTCF-binding sites are indicated by suffixes “upstream” or “downstream”. B: RNA Polymerase 2 occupancy at the same TSSs as shown in A shows that apart from NRXN2, none of the TSSs showed a correspondence between RNA levels and RNA Polymerase 2 occupancy. For PBX1 the Ct values obtained were too low to be used reliably for ddCt analysis and were eliminated. The levels of amplification from the input DNA was used as a quantitation control against respective ChIP. The Y-axis shows the ddCT values on a log2 scale
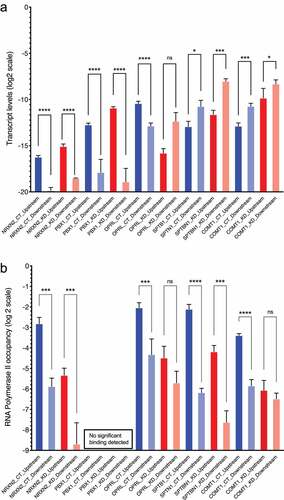
Figure 2. LoB5 shows the expected loss of CTCF occupancy and H3K9me3 asymmetry upon CGGBP1 depletion. A-C: LoB5, GoB4 and LoB3 sites were cloned in the pGL3-control vector. The cloned plasmid was transfected in HEK293T cells with normal and depleted levels of CGGBP1 separately. Total CTCF occupancy at CTCF binding sites (Endogenous and episomal) was compared between CT and KD for LoB5, GoB4 and LOB3. The Ct value for CTCF enrichment was normalized with input and CTCF enrichment is plotted in arbitrary units. Statistical significance was determined by using the unpaired t-test (p-value = 0.05). CTCF binding is strongly reduced at the LoB5 site in KD (a). Depletion of CGGBP1 leads to decreased occupancy of CTCF at the GoB4 site (b) and increased occupancy at the LoB3 site (c). D-F: H3K9me3 levels in the immediate flanks of the endogenous CTCF binding sites were compared between CT and KD. The Ct value for H3K9me3 enrichment was normalized with input and H3K9me3 enrichment is represented in arbitrary units (Y-axis). Statistical significance was determined by using the unpaired t-test (p-value = 0.05). H3K9me3 levels show significant asymmetry in the immediate flanks of the endogenous LoB5 CTCF binding site in CT (p-value < 0.05). The decrease in H3K9me3 levels in the downstream region causes loss of H3K9me3 asymmetry in KD (d). A non-significant asymmetry in H3K9me3 levels is observed in the immediate downstream flanks of the GoB4 CTCF binding site in CT. However, H3K9me3 levels show mild but significant asymmetry in KD (e). The immediate flanks of the LoB3 sites maintained similar levels of H3K9me3 in CT and KD (f)
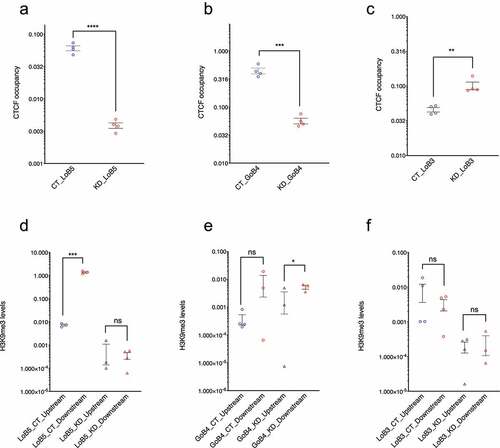
Figure 3. Characterization of CGGBP1-regulated CTCF binding sites in the episomal system. A: Schematic representation of the pGL3-control episomal vector system. Candidate LoB and GoB sites along with approximately 250 bp flanking sequences were cloned upstream of the SV40 promoter. The schematic shows the LoB5 CTCF binding site along with primers used to determine CTCF binding, transcript levels, RNA-Polymerase II, H3K9me3 and H3K27me3 levels at different regions of the episome. B-D: CTCF occupancy at episomal LoB and GoB sites were compared between CT and KD by using primer P3 (cloned CTCF sites forward) and P6 (SV40 promoter reverse). The Ct value for CTCF enrichment was normalized with input and CTCF enrichment is plotted in arbitrary units. Statistical significance was determined by using the unpaired t-test (p-value = 0.05). Episomal LoB5 CTCF binding has shown a strong decrease in CTCF binding in KD (b). CTCF occupancy at the episomal GoB4 site increases significantly (c), similarly, the LoB3 site in the episome shows a significant increase in CTCF binding upon CGGBP1 depletion (d). E-G: H3K9me3 levels at f1Ori and SV40 promoter located upstream and downstream respectively of the episomal CTCF binding sites were compared between CT and KD. The Ct value for H3K9me3 enrichment was normalized with input and H3K9me3 levels are represented as arbitrary units (y-axis). Statistical significance was determined by using the unpaired t-test (p-value = 0.05). H3K9me3 levels are comparable upstream and downstream of the episomal LoB5 site in CT and KD (e). The upstream (f1Ori) of the episomal GoB4 CTCF binding site display comparatively reduced levels of the H3K9me3 than the SV40 promoter in CT. The asymmetric distribution of the H3K9me3 is potentiated in KD (f). Comparable levels of H3K9me3 are observed at f1Ori and SV40 promoter in CT. A strong decrease in H3K9me3 levels at f1Ori increases asymmetry of H3K9me3 levels in the immediate flanks of the episomal LoB3 site in KD
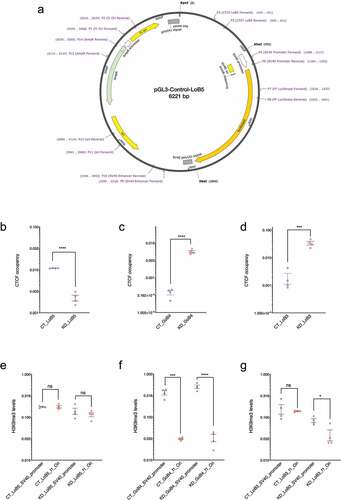
Figure 4. Regulation of the LoB5-SV40 promoter activity by CGGBP1. A: pGL3-LoB5 construct was transfected in HEK293T cells with normal and depleted levels of CGGBP1. Transcript levels were compared at different episomal regions between CT and KD. SV40 Promoter and FF luciferase show a non-significant increase in transcript levels upon removal of CGGBP1. B: Similarly, SV40 promoter, immediate upstream located f1Ori and AmpR regions also show a non-significant increase in transcript levels in the absence of CGGBP1. However, the SV40 enhancer exhibits a strong decline in transcriptional activity, while Ori remains immune to any significant transcriptional changes upon CGGBP1 depletion. C: RNA Polymerase II occupancy was compared across the episomal landscape between CT and KD. In agreement with transcript levels, the SV40 promoter and FF luciferase do not show significant changes in RNA Polymerase II levels. However, f1Ori and AmpR, the immediate upstream regions of the episomal LoB5 site, show a significant decrease in RNA Polymerase II levels in KD. Similarly, RNA Polymerase II levels at SV40 enhancer and Ori portray a significant reduction in KD. D: Ratios of relative RNA abundance to RNA Polymerase II were calculated at different locations on the LoB5 episomal system. The ratios were the lowest at the SV40 promoter and the luciferase gene regions. Unlike other regions, the luciferase gene body showed the lowest ratio of RNA to RNA Polymerase II
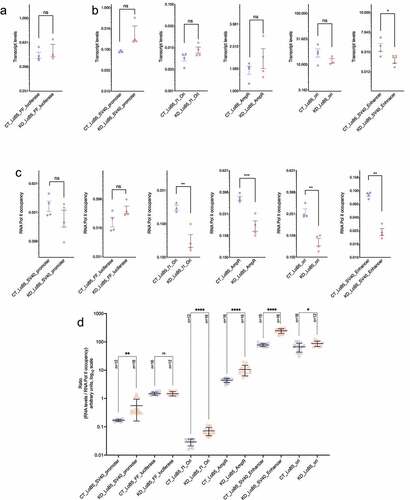
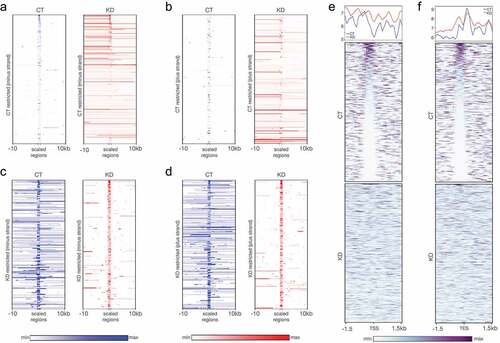
Figure 5. RNA-seq reveals CGGBP1-regulated CTCF binding patterns at transcription restriction sites. (a and b) The short-range weakly transcribing regions in CT (blue) showed stronger transcription in a longer range upon depletion of CGGBP1 in (KD, red) for both minus (a) and plus (b) strands respectively. (c and d) The regions of our genome which exhibit stronger and long-range transcription under normal levels of CGGBP1 (CT, blue) were found to be restricted to short-range transcription upon CGGBP1 knockdown (KD, red) on the minus (c) and plus (d) strands respectively. (e and f) The weakly transcribing regions of the genome in presence of CT were marked by the presence of CTCF-binding that acted as barrier to transcription in the upstream of the start (e) and end (f) sites of the transcripts which was not maintained in KD. The plots show a general disruption of CTCF binding pattern at these transcription restriction sites