Figures & data
Figure 1. RREB1 is highly expressed in gastric cancer tissue but has no significantly with the prognosis of patients
a. Typical IHC staining of RREB1 in normal and gastric cancer tissues. 100x and 200x magnification. RREB1 expressed both in the nucleus and cytoplasm. N = 60.b. The IHC score of RREB1 in gastric cancer is higher than the paired normal gastric tissues,* represents P < 0.05, t test. N = 60.c. RREB1 expression is higher in gastric cancer tissue than the normal gastric tissue by searching the GEPIA database; there were 408 gastric cancer tissues (the red bar) and 211 normal gastric mucosa tissues (the gray bar), and the * represents P < 0.05, t test.d. The overall survival time of the high RREB1 expression patients has no difference compared to the low RREB1 expression patients by searching the GEPIA database.compared to the low RREB1 expression group, P= 0.45, log-rank. N = 408.e. The disease-free survival time of the high RREB1 expression patients has no difference compared to the low RREB1 expression patients by searching the GEPIA database.compared to the low RREB1 expression group. P= 0.73, log-rank. N = 408.
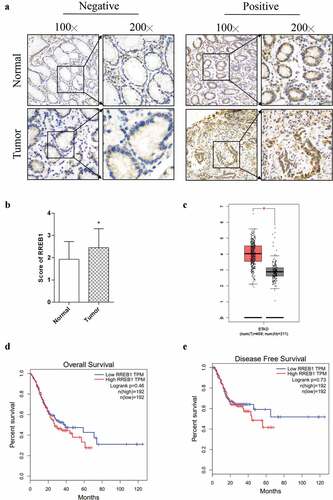
Table 1. Association between the clinicopathological features of CRC patients and RREB1 expression
Figure 2. Knockdown of RREB1 inhibit gastric cancer cell proliferation
a. RREB1 expression in different gastric cancer cell lines. We can see RREB1 is high expressed in SGC-7901 and BGC-823 cell line, but low expressed in AGS and MGC-803 cell line. N = 3.b. Western blotting detection of RREB1 expression in AGS-overexpressing and control cell lines. N = 3.c. Western blotting detection of RREB1 expression in MGC-803 overexpression and control cell lines. N = 3.d. Western blotting detection of RREB1 expression in SGC-7901 knockdown and control cell lines. N = 3.e. Western blotting detection of RREB1 expression in BGC-823 knockdown and control cell lines. N = 3.f. MTT assays show the proliferation of different RREB1 cell lines compared with the control, we found that knockdown RREB1can inhibit cell proliferation on days 4 and 5 for both SGC7901 and BGC823 cell lines. * represents P < 0.05, t test. N = 6.g. Colony formation assays show the ability of cell lines with different RREB1 expression levels and the statistical chart, the result demonstrated that wild-type SGC7901 and BGC823 cells had a higher colony forming ability than the RREB1 knockdown cells.* represents P < 0.05, t test.n = 3.
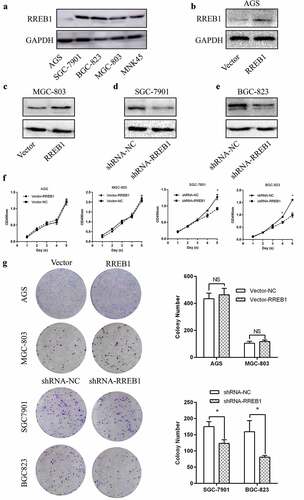
Figure 3. Cell cycle and apoptosis of RREB1 overexpression and knockdown cell lines
a. Flow cytometric detection of the cell cycle in cell lines with different RREB1 expression levels, there were on difference between overexpresion RREB1 and control cell line, but knockdown of RREB1 can lead to a G0 to G1 and G2 to M induce growth arrest. * represents P < 0.05, one-way ANOVA, LSD compared between two groups. N = 5.b. Flow cytometric detection of apoptosis in cell lines with different RREB1 expression levels, there were no difference between both overexpresion and knock down RREB1 cell linle when compared to control group,t test.n = 5.c. Representative Western blot detection of PCNA/Bax in cell lines with different RREB1 expression levels, PCNA was expressed higher in the control group when compared with the RREB1 knockdown group, * represents P < 0.05, t test. N = 3.
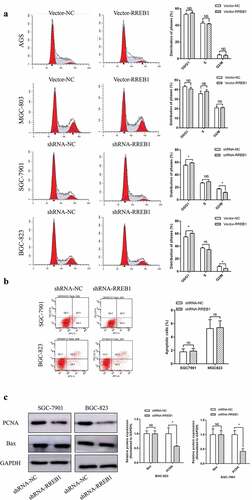
Figure 4. RREB1 promotes cell proliferation in vivo (n = 5)
a. Tumor gross pathological specimens derived from the control and RREB1 knockdown cell lines.b. The tumor growth curve of tumors derived from the BGC-823 control and RREB1 knockdown cells, * represents P < 0.05, ** represents P < 0.01, t test.c. The tumor weights of tumors derived from the BGC-823 control and RREB1 knockdown cells, the result demonstrated that the wild type BGC-823 cell line had a growth advantage over the control group, ** represents P < 0.01, t test.d. Ki67 staining and its IHC scores of control and RREB1 knockdown cell lines, the wild type cell line had a higher Ki67 score than the control group. * represents P < 0.05, t test. 200x magnification.
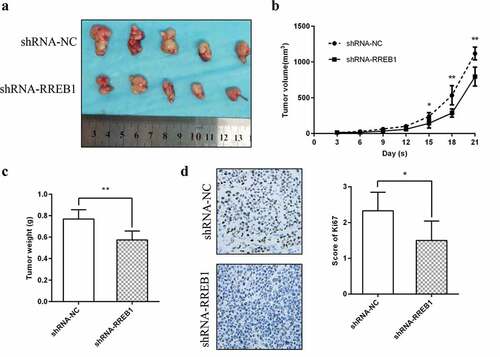
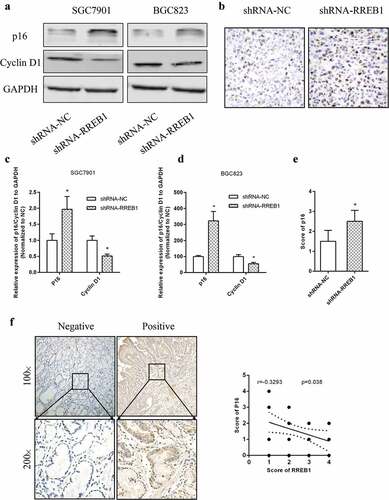
Figure 5. Knockdown of RREB1 inhibits cell proliferation via enhanced p16 expression
a/c/d. Knockdown RREB1 can promote P16 expression but inhibit cyclin D1 expression compared to control cell lines and the statistical graph, * represents P < 0.05. n = 3.b/e. Knockdown of RREB1 can enhance p16 expression in vivo, the typical image and IHC staining score of p16 in the mice tumor tissues, * represents P < 0.05.n = 6, for each group.F. The typical imgae of IHC staining of p16 in gastric cancer tissue and its expression was correlations with RREB1 expression. Pearson test, P < 0.05, r = 0.3293.n = 60.