981
Views
4
CrossRef citations to date
0
Altmetric
Research Paper

Long non-coding RNA MCM3AP antisense RNA 1 silencing upregulates microRNA-24-3p to accelerate proliferation and migration of vascular endothelial cells in myocardial infarction rats by reducing EIF4G2

, , , , , & show all
Pages 674-684 | Received 11 Nov 2020, Accepted 29 Sep 2021, Published online: 03 Feb 2022

Figures & data

Table 1. Primer sequence for RT-qPCR

Figure 1. Silenced MCM3AP-AS1 or elevated miR–24–3p improves cardiac function of MI rats. A, LVSP of rats in each group; B, LVEDP of rats in each group; C, + dp/dtmax of rats in each group; D, – dp/dtmax of rats in each group; * P < 0.05 vs the sham group, ^ P < 0.05 vs the si-NC group, & P < 0.05 vs the agomir NC group, # P < 0.05 vs the miR–24–3p agomir group; n= 10; the data were expressed as mean ± standard deviation, one-way ANOVA was used for comparisons among multiple groups and Tukey’s post hoc test was used for pairwise comparisons after one-way ANOVA.

Figure 1. Silenced MCM3AP-AS1 or elevated miR–24–3p improves cardiac function of MI rats. A, LVSP of rats in each group; B, LVEDP of rats in each group; C, + dp/dtmax of rats in each group; D, – dp/dtmax of rats in each group; * P < 0.05 vs the sham group, ^ P < 0.05 vs the si-NC group, & P < 0.05 vs the agomir NC group, # P < 0.05 vs the miR–24–3p agomir group; n= 10; the data were expressed as mean ± standard deviation, one-way ANOVA was used for comparisons among multiple groups and Tukey’s post hoc test was used for pairwise comparisons after one-way ANOVA.
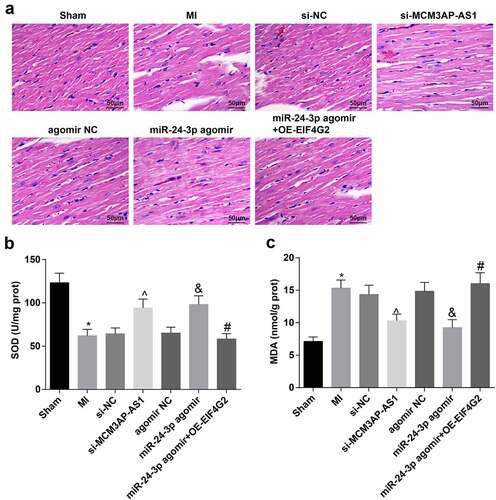
Figure 2. Downregulated MCM3AP-AS1 or enhanced miR–24–3p attenuates myocardial injury in MI rats. A, representative images of HE staining (× 200); B, SOD activity in rat myocardial tissues; C, MDA content in rat myocardial tissues; * P < 0.05 vs the sham group, ^ P < 0.05 vs the si-NC group, & P < 0.05 vs the agomir NC group, # P < 0.05 vs the miR–24–3p agomir group; n = 5; the data were expressed as mean ± standard deviation, one-way ANOVA was used for comparisons among multiple groups and Tukey’s post hoc test was used for pairwise comparisons after one-way ANOVA.
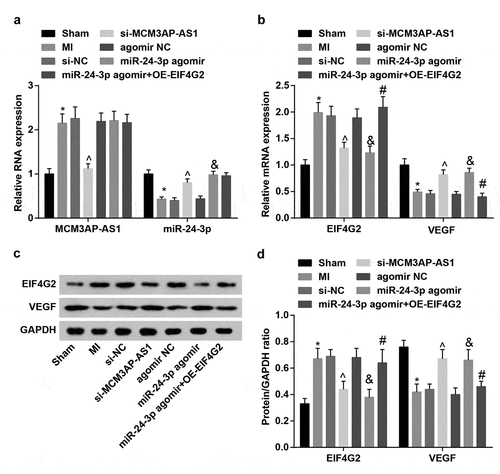
Figure 2. Downregulated MCM3AP-AS1 or enhanced miR–24–3p attenuates myocardial injury in MI rats. A, representative images of HE staining (× 200); B, SOD activity in rat myocardial tissues; C, MDA content in rat myocardial tissues; * P < 0.05 vs the sham group, ^ P < 0.05 vs the si-NC group, & P < 0.05 vs the agomir NC group, # P < 0.05 vs the miR–24–3p agomir group; n = 5; the data were expressed as mean ± standard deviation, one-way ANOVA was used for comparisons among multiple groups and Tukey’s post hoc test was used for pairwise comparisons after one-way ANOVA.

Figure 3. MCM3AP-AS1 and EIF4G2 are upregulated while miR–24–3p and VEGF are downregulated in MI rat myocardial tissues. A, expression of MCM3AP-AS1 and miR–24–3p in rat myocardial tissues; B, expression of EIF4G2 and VEGF in rat myocardial tissues; C, protein bands of EIF4G2 and VEGF; D, protein expression of EIF4G2 and VEGF in rat myocardial tissues; * P < 0.05 vs the sham group, ^ P < 0.05 vs the si-NC group, & P < 0.05 vs the agomir NC group, # P < 0.05 vs the miR–24–3p agomir group; n = 5; the data were expressed as mean ± standard deviation, one-way ANOVA was used for comparisons among multiple groups and Tukey’s post hoc test was used for pairwise comparisons after one-way ANOVA.
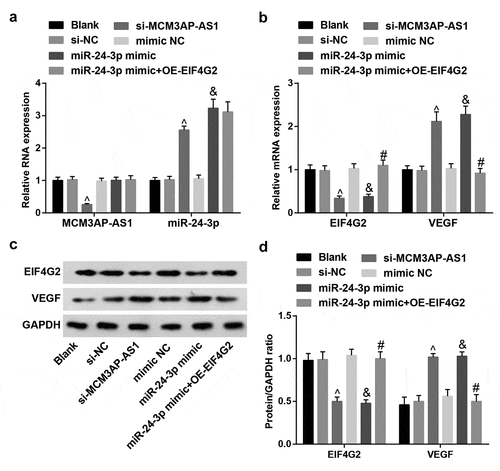
Figure 3. MCM3AP-AS1 and EIF4G2 are upregulated while miR–24–3p and VEGF are downregulated in MI rat myocardial tissues. A, expression of MCM3AP-AS1 and miR–24–3p in rat myocardial tissues; B, expression of EIF4G2 and VEGF in rat myocardial tissues; C, protein bands of EIF4G2 and VEGF; D, protein expression of EIF4G2 and VEGF in rat myocardial tissues; * P < 0.05 vs the sham group, ^ P < 0.05 vs the si-NC group, & P < 0.05 vs the agomir NC group, # P < 0.05 vs the miR–24–3p agomir group; n = 5; the data were expressed as mean ± standard deviation, one-way ANOVA was used for comparisons among multiple groups and Tukey’s post hoc test was used for pairwise comparisons after one-way ANOVA.
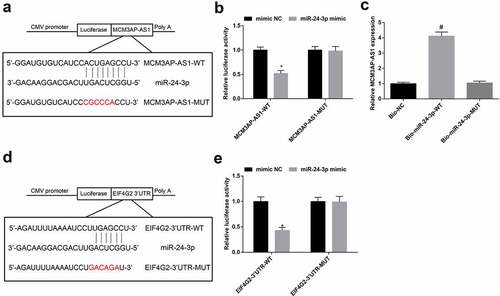
Figure 4. MCM3AP-AS1 silencing or miR–24–3p elevation promotes VEC proliferation and migration. A, VEC proliferation was detected by MTT assay; B, VEC migration was detected by transwell assay; C, comparison of migrative VECs among the groups; ^ P < 0.05 vs the si-NC group, & P < 0.05 vs the mimic NC group, # P < 0.05 vs the miR–24–3p mimic group; N= 3; the data were expressed as mean ± standard deviation, one-way ANOVA was used for comparisons among multiple groups and Tukey’s post hoc test was used for pairwise comparisons after one-way ANOVA.

Figure 4. MCM3AP-AS1 silencing or miR–24–3p elevation promotes VEC proliferation and migration. A, VEC proliferation was detected by MTT assay; B, VEC migration was detected by transwell assay; C, comparison of migrative VECs among the groups; ^ P < 0.05 vs the si-NC group, & P < 0.05 vs the mimic NC group, # P < 0.05 vs the miR–24–3p mimic group; N= 3; the data were expressed as mean ± standard deviation, one-way ANOVA was used for comparisons among multiple groups and Tukey’s post hoc test was used for pairwise comparisons after one-way ANOVA.

Figure 5. Expression of MCM3AP-AS1, miR–24–3p, EIF4G2 and VEGF in VECs. A, expression of MCM3AP-AS1 and miR–24–3p in VECs of each group; B, expression of EIF4G2 and VEGF in VECs of each group; C, protein bands of EIF4G2 and VEGF; D, protein expression of EIF4G2 and VEGF in VECs of each group; ^ P < 0.05 vs the si-NC group, & P < 0.05 vs the mimic NC group, # P < 0.05 vs the miR–24–3p mimic group; N = 3; the data were expressed as mean ± standard deviation, one-way ANOVA was used for comparisons among multiple groups and Tukey’s post hoc test was used for pairwise comparisons after one-way ANOVA.

Figure 5. Expression of MCM3AP-AS1, miR–24–3p, EIF4G2 and VEGF in VECs. A, expression of MCM3AP-AS1 and miR–24–3p in VECs of each group; B, expression of EIF4G2 and VEGF in VECs of each group; C, protein bands of EIF4G2 and VEGF; D, protein expression of EIF4G2 and VEGF in VECs of each group; ^ P < 0.05 vs the si-NC group, & P < 0.05 vs the mimic NC group, # P < 0.05 vs the miR–24–3p mimic group; N = 3; the data were expressed as mean ± standard deviation, one-way ANOVA was used for comparisons among multiple groups and Tukey’s post hoc test was used for pairwise comparisons after one-way ANOVA.

Figure 6. Interaction among MCM3AP-AS1, miR–24–3p and EIF4G2. A, binding sites of MCM3AP-AS1 and miR–24–3p were predicted at http://starbase.sysu.edu.cn/; B, binding relation between MCM3AP-AS1 and miR–24–3p was confirmed by dual luciferase reporter gene assay; C, binding relation between MCM3AP-AS1 and miR–24–3p was confirmed by RNA pull-down assay; D, binding sites of miR–24–3p and EIF4G2 were predicted at http://starbase.sysu.edu.cn/; E, binding relation between miR–24–3p and EIF4G2 was confirmed by dual luciferase reporter gene assay; * P < 0.05 vs the mimic NC group, # P < 0.05 vs the Bio-NC group; N = 3; the data were expressed as mean ± standard deviation, the unpaired t-test was performed for comparisons between two groups, one-way ANOVA was used for comparisons among multiple groups and Tukey’s post hoc test was used for pairwise comparisons after one-way ANOVA.

Figure 6. Interaction among MCM3AP-AS1, miR–24–3p and EIF4G2. A, binding sites of MCM3AP-AS1 and miR–24–3p were predicted at http://starbase.sysu.edu.cn/; B, binding relation between MCM3AP-AS1 and miR–24–3p was confirmed by dual luciferase reporter gene assay; C, binding relation between MCM3AP-AS1 and miR–24–3p was confirmed by RNA pull-down assay; D, binding sites of miR–24–3p and EIF4G2 were predicted at http://starbase.sysu.edu.cn/; E, binding relation between miR–24–3p and EIF4G2 was confirmed by dual luciferase reporter gene assay; * P < 0.05 vs the mimic NC group, # P < 0.05 vs the Bio-NC group; N = 3; the data were expressed as mean ± standard deviation, the unpaired t-test was performed for comparisons between two groups, one-way ANOVA was used for comparisons among multiple groups and Tukey’s post hoc test was used for pairwise comparisons after one-way ANOVA.
Supplemental material

Supplemental Material

Download MS Word (11.5 KB)

Supplemental Material

Download MS Word (173 KB)