Figures & data
Table 1. The relations between WT1-AS expression and clinical pathology factors
Figure 1. LncRNA WT1-AS shows low expression in cervical cancer. a, The screening heatmap of microarray GSE63678. b, The expression of lncRNA WT1-AS in cervical cancer tissues and adjacent tissues analyzed in the TCGA database. c, The expression of lncRNA WT1-AS in several other cancers analyzed in the TCGA database. d, The expression of lncRNA WT1-AS in cancer tissues and adjacent tissues, * p < 0.05 vs. the normal tissues. E, Kaplan Meier method of lncRNA WT1-AS expression and survival in patients with cervical cancer. F, The expression of lncRNA WT1-AS in human immortalized cervical epithelial cells H8 and cervical cancer cells HCE1, SiHa and Hela, * p < 0.05 vs. the H8 cells, # p < 0.05 vs. the HCE1 and SiHa cells. Figure D is analyzed using the paired t test, and figure E using one-way ANOVA with Tukey’s post hoc test. The cell experiments were repeated three times. lncRNA WT1-AS, long non-coding RNA Wilms tumor 1 homolog antisense RNA; PIK3AP1, phosphoinositide-3-kinase adaptor protein 1; SPI1, Spleen focus forming virus proviral integration oncogene 1
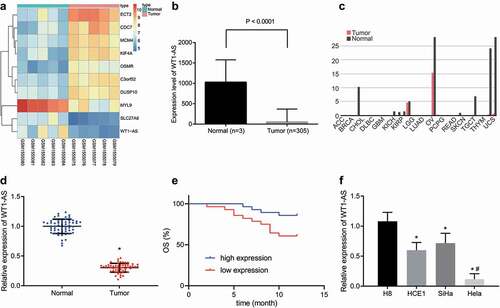
Figure 2. LncRNA WT1-AS suppressed proliferation and autophagy while promoted apoptosis of cervical cancer cells. a, The expression of lncRNA WT1-AS measured by RT-qPCR. b-c, The protein expression of Beclin1, Bcl-1, LC3II, LC3I, Cleaved-caspase3 and Bax determined by Western blot assay. d, The proliferation rate of cancer cells transfected with oe-WT1-AS detected by EdU staining. e, The autophagy of cancer cells transfected with oe-WT1-AS detected by MDC staining. f, Analysis of cell apoptosis in cancer cells transfected with oe-WT1-AS analyzed by flow cytometry. * p < 0.05 compared with negative control (NC) plasmids transfected cells. The above results are all measurement data, expressed as mean ± standard derivation. The unpaired t-test was used and the cell experiment was repeated three times. EdU, 5-ethynyl-2ʹ-deoxyuridine; MDC, Monodansylcadaverine; Bax, Bcl2 associated X, apoptosis regulator; Bcl-2, B cell leukemia/lymphoma 2; LC3I/II, microtubule-associated protein 1 light chain 3; ANOVA, analysis of variance; NC, negative control
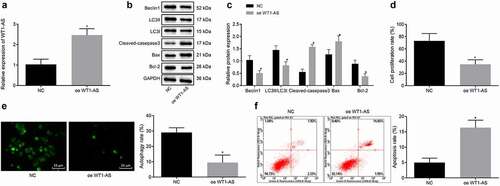
Figure 3. LncRNA WT1-AS might regulate PIK3AP1 expression via SPI1. a, Location of lncRNA WT1-AS in cells determined by cell fractionation experiments; b, The expression localization of lncRNA WT1-AS detected by nuclear separation; c, The predicted regulating mechanism of lncRNA WT1-AS analyzed on the LncMAP website. d, The expression of PIK3AP1 in cervical cancer tissues and adjacent tissues analyzed in TCGA database; e, The screening heatmap of microarray GSE63514. TCGA, The cancer genome atlas
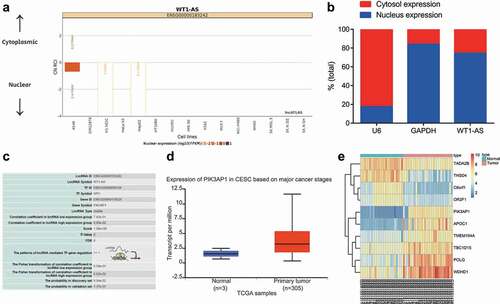
Figure 4. LncRNA WT1-AS inhibited PIK3AP1 expression by recruiting SPI1. a, The enrichment of lncRNA WT1-AS and SPI1 detected by RIP assay; b, The enrichment of SPI1 in PIK3AP1 promoter region detected by ChIP assay, where * p < 0.05 compared with that of the cells treated by IgG; c, The binding fluorescence intensity of lncRNA WT1-AS and PIK3AP1 promoter region detected by dual luciferase reporter gene assay; d, The relative expression of lncRNA WT1-AS and PIK3AP1 in cells transfected with oe-WT1-AS; e, The relative protein expression of PIK3AP1 and lncRNA WT1-AS in cells after transfected with oe-WT1-AS, where * p < 0.05 compared with that of the NC treated cells. f, The relative mRNA expression of PIK3AP1. g, The relative protein expression of PIK3AP1, where * p < 0.05 compared with that of cells treated with oe-NC and si-NC, # p < 0.05 compared with that of cells treated with oe-WT1-AS and si-NC. The above results are all measurement data, expressed as mean ± standard derivation and analyzed using an unpaired t-test. The cell experiments were repeated three times. IgG, immunoglobulin G; ChIP, chromatin Immunoprecipitation; FISH, Fluorescence In Situ Hybridization; RIP, RNA binding protein immunoprecipitation; WT, wild type; MUT, mutant
Figure 5. LncRNA WT1-AS inhibited cervical cancer by inhibiting PIK3AP1 through recruiting SPI1. a, The expression of lncRNA WT1-AS and PIK3AP1 mRNA in different cells lines; b-c, The expression of Beclin1, Bcl-1, LC3II, LC3I, cleaved-caspase3, and Bax protein; d, The proliferation rate of cancer cells transfected with NC, oe-WT1-AS, sh-PIK3AP1 or co-transfected with oe-WT1-AS and sh-PIK3AP1 detected by EdU staining (× 200); e, The proliferation rate of cancer cells transfected with NC, oe-WT1-AS, sh-PIK3AP1 or co-transfected with oe-WT1-AS and oe-PIK3AP1 detected by RT-qPCR and western blot assay; f, The autophagy of cancer cells transfected with NC, oe-WT1-AS, sh-PIK3AP1 or co-transfected with oe-WT1-AS and oe-PIK3AP1 detected by MDC staining; G, The apoptosis of cancer cells transfected with NC, oe-WT1-AS, sh-PIK3AP1 or co-transfected with oe-WT1-AS and oe-PIK3AP1 detected by flow cytometry. * p < 0.05 compared with the NC treated cells, # p < 0.05 compared with that of the cells transfected with oe-WT1-AS. The above results are measurement data, expressed as mean ± standard derivation, analyzed by an unpaired t-test, and the cell experiments were repeated three times. mRNA, message RNA; RT-qPCR, quantitative Reverse transcription polymerase chain reaction; EDU, 5-ethynyl-2’-deoxyuridine; MDC staining, Monodansylcadaverine staining
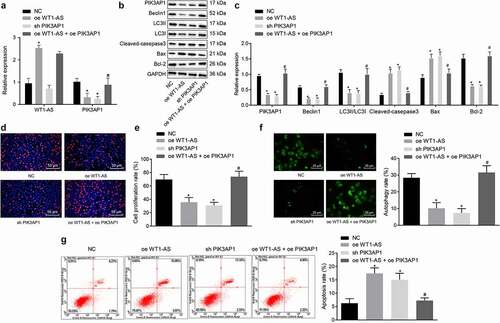
Figure 6. LncRNA WT1-AS suppressed cervical cancer development in vivo. a, Representative images of xenograft tumors in mice implanted with cells transfected with NC, oe-WT1-AS, h-PIK3AP1 or co-transfected with oe-WT1-AS and oe-PIK3AP1; b, The volume change of tumor in mice transfected with NC, oe-WT1-AS, sh-PIK3AP1 or co-transfected with oe-WT1-AS and oe-PIK3AP1; c-d, The expression of PIK3AP1 protein in mice transfected with NC, oe-WT1-AS, sh-PIK3AP1 or co-transfected with oe-WT1-AS and oe-PIK3AP1; * p < 0.05 compared with that treated with NC, # p < 0.05 compared with that treated with oe-WT1-AS. n = 10. The above results are all measurement data, expressed as mean ± standard derivation. The data comparison between multiple groups is performed by one-way ANOVA with Tukey’s post hoc test; the data comparison among groups at different time points is performed by repeated measurement ANOVA with Bonferroni’s post hoc test. ANOVA, analysis of variance; N, number of samples
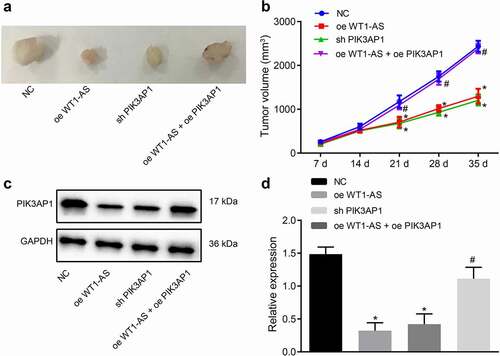
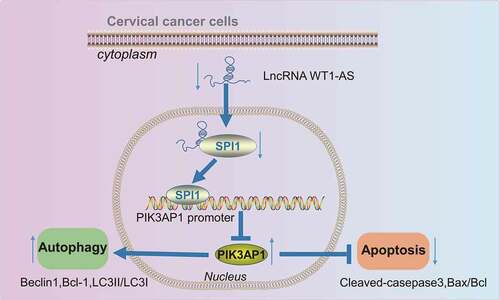
Figure 7. Molecular mechanism of lncRNA WT1-AS in regulating autophagy and apoptosis of cervical cancer cells via transcription factor mediated effects on the SPI1/PIK3AP1 axis