
Figures & data
Table 1. The relationship between LIFR-AS1 expression and PC patient clinic-pathological features.
Figure 1. PC samples exhibit the upregulation of LIFR-AS1.
(a) LIFR-AS1 levels in 139 pairs of PC tissues and adjacent normal tissues were quantified via qRT-PCR. *P < 0.05 vs. adjacent normal. (b) Expression of LIFR-AS1 was quantified in the AsPC-1, BxPC-3, Mia-capa2, HPAC, and PANC-1 PC cell lines and in the control HPDE cell line via qRT-PCR. *P < 0.05 vs. HPDE. *P < 0.05; **P < 0.01; ***P < 0.001; P > 0.05.
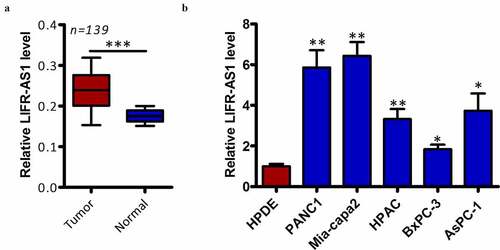
Figure 2. METTL3 induced LIFR-AS1 m6A to enhance ItsmRNA stability in PC.
(a) The correlation the METTL3 and LIFR-AS1 in PC based on GEPIA database. (b, c) qRT-PCR analysis of the level of METTL3 and LIFR-AS1 in indicated PC cell lines. (d) Identify the specific m6A methylation loci of LIFR-AS1 by SRAMP website. (e) m6A level in LIFR-AS1 in PANC1 and Mia-capa cells with sh-NC or sh-METTL3 line by m6A-qPCR. (f) qRT-PCR analysis of LIFR-AS1 mRNA relative to ACTIN in indicated treated PC. *P < 0.05; **P < 0.01; ***P < 0.001; P > 0.05.
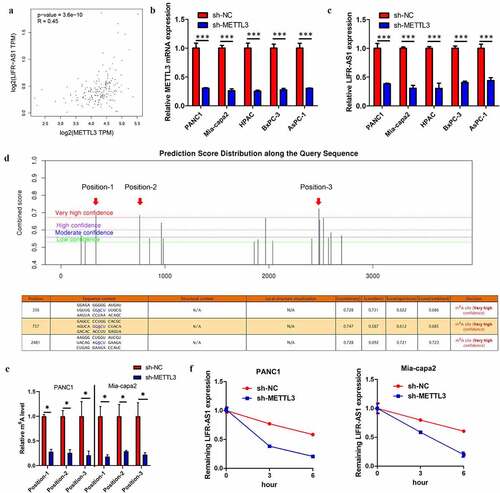
Figure 3. Reduced levels of LIFR-AS1 impair the proliferation, invasion, and survival of PC cellsin vitro.
(a) Expression of LIFR-AS1 in PANC1 and Mia-capa2 cells that had been transfected with si-LIFR-AS1 or si-NC constructs was assessed via qRT-PCR. (b) A CCK-8 assay was used to gauge the proliferation of cells transfected as in A. (c, d) the migration (c) and invasive (d) activity of cells transfected as in A were assessed using a Transwell assay system. *P < 0.05; **P < 0.01; ***P < 0.001.
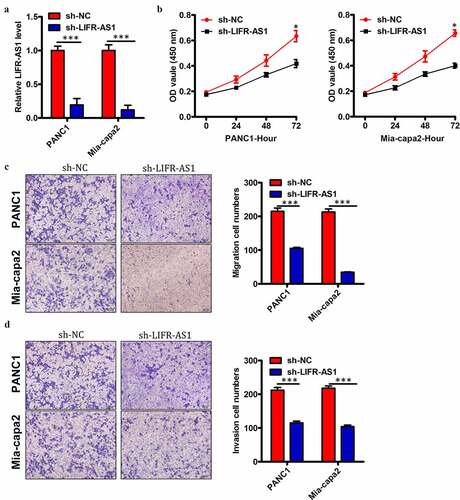
Figure 4. LIFR-AS1 interacts with and sequesters miR-150-5p within PC cells.
(a) miR-150-5p interaction with LIFR-AS1 was predicted via bioinformatic analyses. (b) The expression of miR-150-5p was quantified in PANC1 and Mia-capa2 cells that had undergone agomir-150-5p or agomir-NC transfection. (c) Wild type (WT)-LIFR-AS1 or mutant (MUT)-LIFR-AS1 were co-transfected into PANC1 and Mia-capa2 cells along with agomir-150-5p or agomir-NC, and after 48 h luciferase activity was measured. (d) Higher levels of LIFR-AS1 and miR-150-5p were detectable in immunoprecipitates containing Ago2 relative to those prepared using a control IgG. (e) Levels of miR-150-5p expression in 139 pairs of PC and paracancerous control tissues were quantified via qRT-PCR. (f) A Spearman’s correlation analysis of the relationship between miR-150-5p and LIFR-AS1 expression in PC tissue samples from E was conducted. (g) Levels of miR-150-5p were measured via qRT-PCR in PANC1 and Mia-capa2 cells in which LIFR-AS1 had been knocked down. *P < 0.05; **P < 0.01; ***P < 0.001; #P > 0.05.
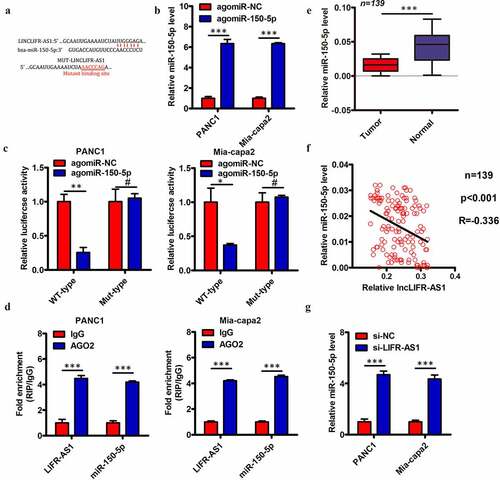
Figure 5. LIFR-AS1 serves as a ceRNA that sequesters miR-150-5p and thus alters the expression of VEGFA in PC cells.
(a, b) VEGFA expression was quantified via qRT-PCR and Western blotting in PANC1 and Mia-capa2 cells transfected using si-LIFR-AS1 or control constructs. (c) Following transfection with antagomir-150-5p or antagomir-NC, miR-150-5p levels in PC cell lines were confirmed via qRT-PCR. (d, e) PC cell lines were co-transfected with si-LIFR-AS and antagomir-150-5p or antagomir-NC after which VEGFA levels were measured via qRT-PCR and Western blotting. *P < 0.05; **P < 0.01; ***P < 0.001; #P > 0.05.
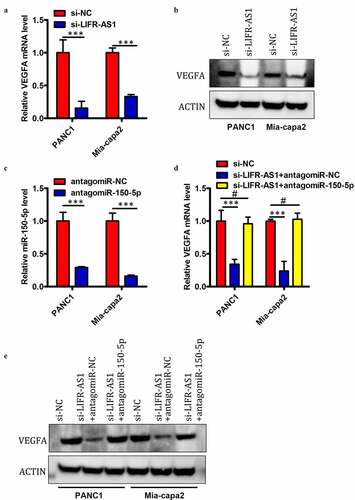
Figure 6. LIFR-AS1 targets miR-150-5p to activate VEGFA/Akt/mTOR Signaling.
Western blot was used to measure the expression of VEGFA, VEGFR2, p-VEGFR2, Akt, p-Akt, mTOR, p-mTOR in transfected PANC1 and Mia-capa2 cells.
Supplemental material