Figures & data
Figure 1. Hsa_circ_0065217 characterization in RCC. (a) Venn diagrams demonstrate aberrant circRNAs in GSE137836 and GSE100186 datasets. (b) The information of hsa_circ_0065217 (has_circRNA_103349). (c) Hsa_circ_0065217 validation by expression assays. Divergent primers amplified hsa_circ_0065217 from cDNA but not genomic DNA. (d) QRT-PCR was used to determine hsa_circ_0065217 and linear SCAP mRNA abundance in RCC cells incubated with RNase R. *P < 0.05
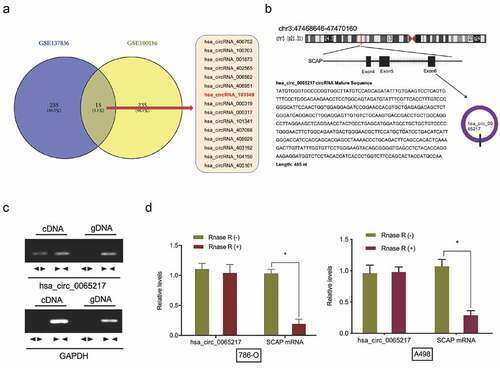
Figure 2. Hsa_circ_0065217 is elevated in RCC. (a) Expression of hsa_circ_0065217 in GSE100186 and GSE137836 databsets. (b-d) Hsa_circ_0065217 expression in RCC tissue and cell lines by qRT-PCR. (e-g) Elevated hsa_circ_0065217 levels were associated with advanced TNM stages, lymph-node metastasis and larger tumor sizes in RCC patients. *P < 0.05
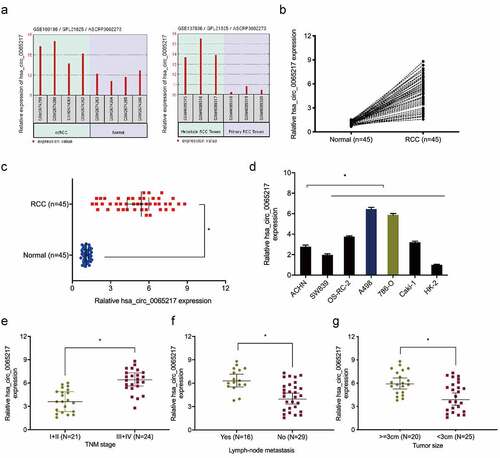
Figure 3. Hsa_circ_0065217 silencing reduces RCC growth phenotypes. (a) Hsa_circ_0065217 silencing in RCC cells. (b-d) Hsa_circ_0065217 inhibits RCC proliferation. (e) The impact of hsa_circ_0065217 silencing on RCC by Transwell assay. (f, g) E-cadherin and vimentin levels in RCC cells transfected with si-circ_0065217 were explored by qRT-PCR and Western blot. *P < 0.05
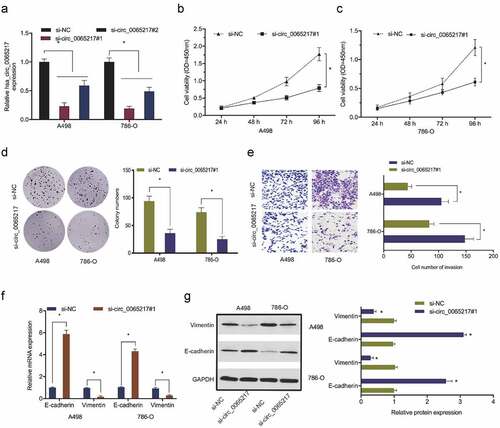
Figure 4. MiR-214-3p is a hsa_circ_0065217 target. (a) Hsa_circ_0065217 cellular distribution was analyzed using a cellular RNA fractionation assay. (b, c) Potential binding targets of hsa_circ_0065217 predicted by circBank and miRanda. (d) Potential target miRNAs expression in TCGA datasets. (e, f) miR-214-3p was pulled down by using a hsa_circ_0065217 specific probe. (g) MiR-214-3p expression in the Cancer Genome Atlas (TCGA) database. (h, i) MiR-214-3p expression in RCC tissue and cell lines. *P < 0.05
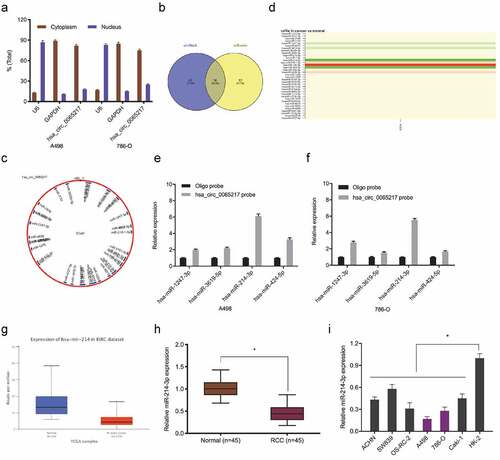
Figure 5. Hsa_circ_0065217 is a miR-214-3p sponge. (a-c) MiR-214-3p overexpression impacts RCC growth phenotypes. (d-f) Luciferase data shows miR-214-3p mimics inhibited hsa_circ_0065217-WT activity in RCC cells. (g) Hsa_circ_0065217 silencing evaluated miR-214-3p in RCC cells. (h) Hsa_circ_0065217 and miR-214-3p enrichment on Ago2-beads in RCC cells. (i) Hsa_circ_0065217 was inversely linked with miR-214-3p levels in RCC tissue. *P < 0.05
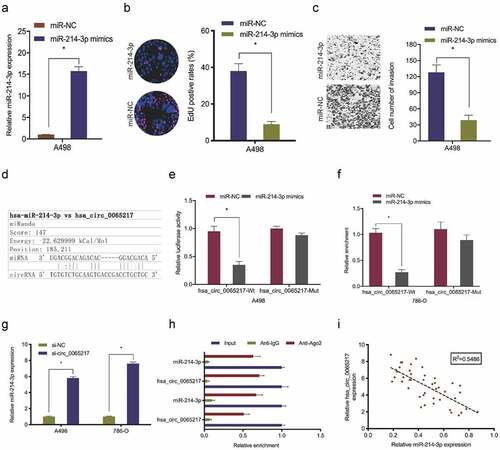
Figure 6. ALPK2 is highly expressed in RCC. (a) Potential binding targets for miR-214-3p as predicted by miRTarBase, MicroT-CDS, and miDIP databases. (b) Potential target gene expression in the Cancer Genome Atlas (TCGA). (c) ALPK2 levels in TCGA samples. (d, e) ALPK2 expression in RCC tissue was explored by qRT-PCR and IHC. (f, g) High ALPK2 expression was linked with poor prognoses in patients with RCC. *P < 0.05
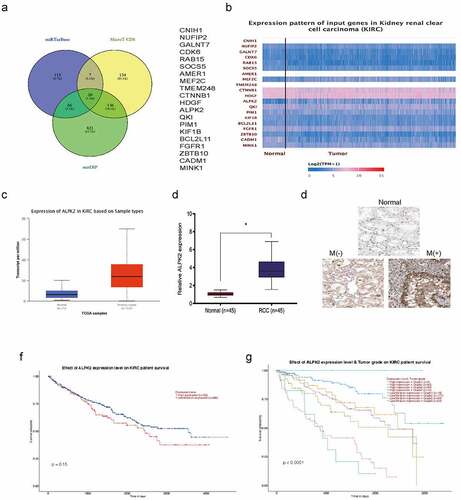
Figure 7. ALPK2 is a direct target of miR-214-3p. (a, b) Luciferase data shows miR-214-3p mimics inhibited ALPK2-WT activity in RCC cells. (c, d) miR-214-3p suppression abolished the roles of ALPK2 inhibition on RCC cells proliferation and invasion. (e) MiR-214-3p mimics reduced ALPK2 expression in RCC cells. (f) MiR-214-3p was inversely linked with ALPK2 levels in RCC tissues. *P < 0.05
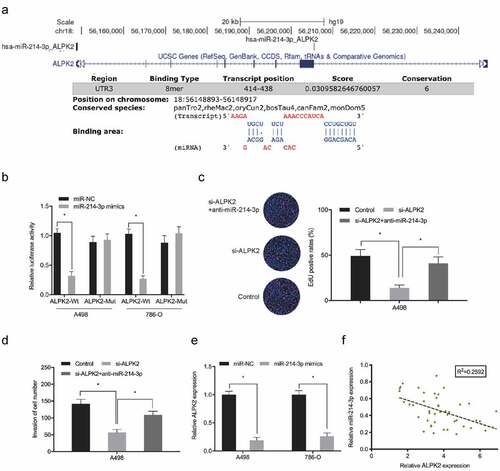
Figure 8. Oncogenic hsa_circ_0065217/miR-214-3p/ALPK2 signaling in RCC cells. (a, b) ALPK2 expression levels in RCC cells transfected with si-circ_0065217 or miR-214-3p inhibitors. (c, d) Forced ALPK2 expression reversed hsa_circ_0065217 silencing effects on RCC cells colony formation and invasion. (e) High ALPK2 levels were positively correlated with hsa_circ_0065217 levels in RCC tissue. *P < 0.05