
Figures & data
Figure 1. Microarray results determined using Affymetrix GeneChip PrimeView Human Gene Expression arrays. (a) Scatter plot of DEGs in AsPC-1 cells exposed to MLN4924. Each dot marks a specific gene, and the x-coordinate and y-coordinate stand for the signaling strength of the probe in the NC group and drug group respectively. The red dots mark genes that were relatively up-regulated in cells exposed to MLN4924, while green dots mark genes that were relatively up-regulated in control cells. (b) Volcano plot of DEGs in AsPC-1 cells exposed to MLN4924. The significantly changed genes are marked in red. The chosen thresholds were a |fold change| ≥ 2 and a FDR ≤ 5%. (c) Number of DEGs in AsPC-1 cells exposed to MLN4924.
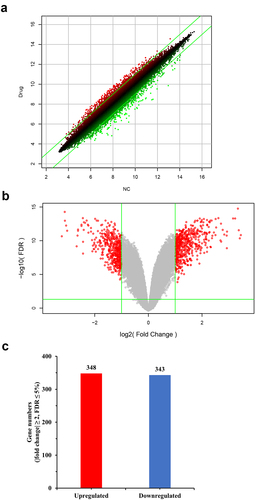
Figure 2. Canonical pathway and function analysis based on information from the Ingenuity Pathways Knowledge Base. (a) 11 significantly altered canonical pathways. The chosen thresholds were a |fold change| ≥ 2 and p < 0.05. A z-score ≥ 2 indicates significant activation of the pathway, and a z-score ≤ −2 indicates significant inhibition. The ratio of DEGs to the total genes of the pathway is also marked. (b) Functions significantly down-regulated due to MLN4924 exposure. The chosen thresholds were a z-score ≥ 2 and p < 0.05. (c) Functions significantly up-regulated due to MLN4924 exposure. The chosen thresholds were a z-score ≤ −2 and p < 0.05.
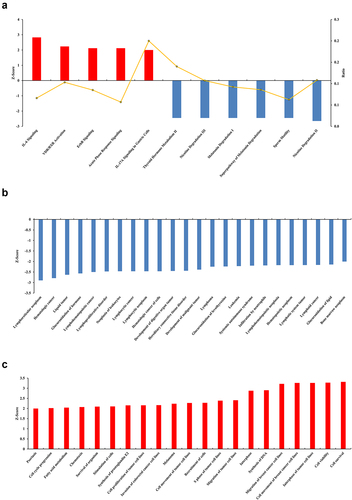
Figure 3. Upstream analysis and regulatory effect analysis based on information from the Ingenuity Pathways Knowledge Base. (a) Upstream analysis shows that tumor necrosis factor (TNF) as the most activated upstream regulator and its downstream targets. The chosen thresholds were a |z-score| ≥ 2 and p < 0.05. (b) The regulatory effect analysis map shows the possible pathways of upstream regulatory networks and downstream functions involving the DEGs. Genes that are up- or down-regulated are labeled in red and green, respectively. Orange line indicates that TNF is predicted to lead to the activation of its downstream molecule, blue line indicates that TNF is predicted to lead to the inhibition of its downstream molecule, yellow line indicates that findings are inconsistent with the state of the downstream molecule, and gray line indicates that no data exists regarding the state of the downstream molecule.
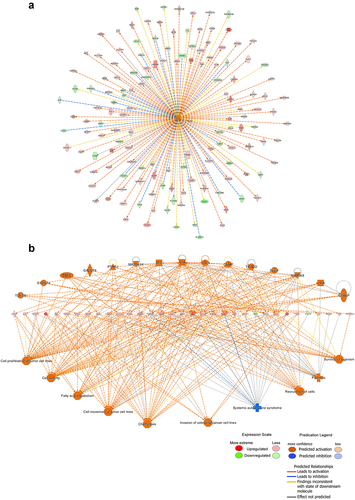
Figure 4. Interaction network analysis based on information from the Ingenuity Pathways Knowledge Base. The interaction network graph shows the interactions among molecules in datasets. Genes that are up- or down-regulated are labeled in red and green, respectively.
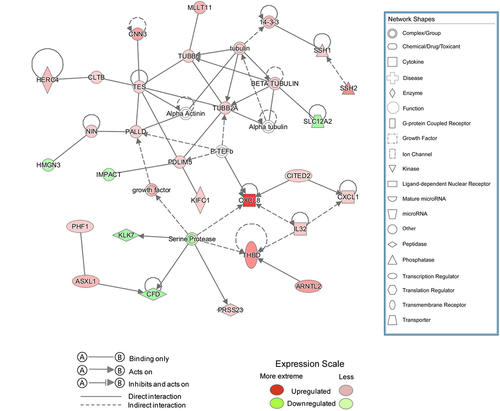
Table 1. The synergism of knocking down target genes using mixed shRNAs and MLN4924
Table 2. The synergism of knocking down target genes using single shRNAs and MLN4924
Figure 5. Knockdown effects of target genes using single shRNAs. (a) RT-qPCR analysis showed that 22 (black columns) of the 30 selected down-regulated DEGs were confirmed to to have significantly reduced mRNA levels. (b-e) RT-qPCR analysis verified the knockdown effects of single shRNAs for PDE11A, NAPEPLD, LGALS2, MOB3B, respectively. *, P < 0.05; **, P < 0.01; ***, P < 0.001; n.s., not significant.
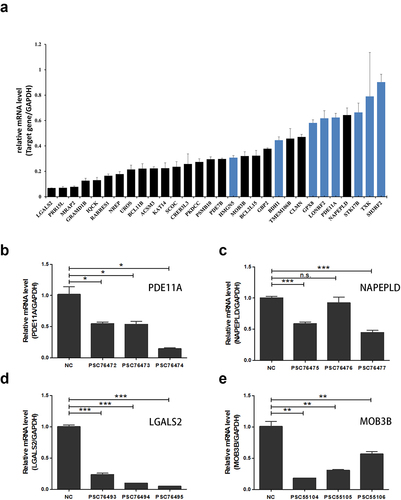
Figure 6. NAPEPLD knockdown Enhances the sensitivity of pancreatic cancer cells to MLN4924. (a, b) RT-qPCR and Western blots confirmed the effective knockdown of NAPEPLD in both AsPC-1 and SW 1990 cells. (c, d) MTT assay showed that MLN4924 inhibited the growth of NAPEPLD knockdown cells more strongly than control cells. (e, f) FACS analysis showed that the number of cells in the S phase was increased in NAPEPLD knockdown cells compared to control cells when treated with MLN4924. *, P < 0.05; **, P < 0.01; ***, P < 0.001.
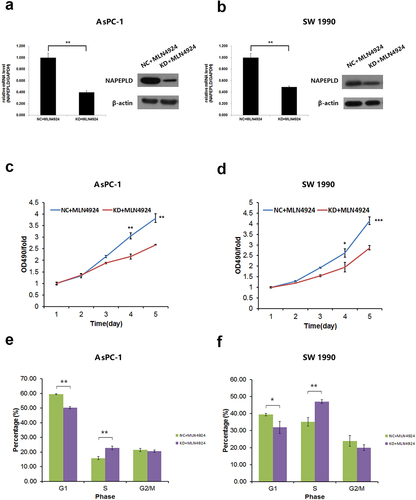
Figure 7. NAPEPLD knockdown increased the apoptosis caused by MLN4924 in pancreatic cancer cells. (a, b) FACS analysis showed that the percentage of apoptotic cells was increased in NAPEPLD knockdown cells when treated with MLN4924. (c, d) Caspase 3/7 assay showed that the percentage of apoptotic cells was increased in NAPEPLD knockdown cells when treated with MLN4924.
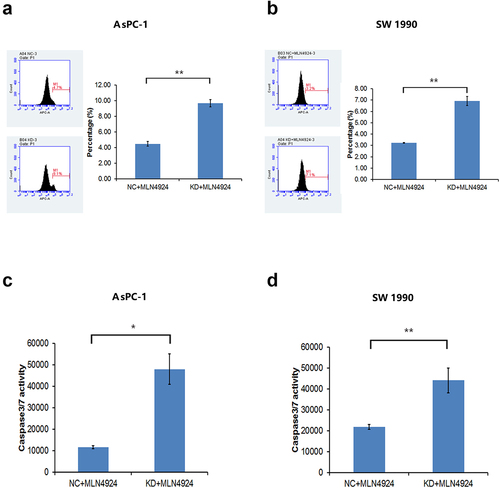
Figure 8. NAPEPLD knockdown Enhanced the sensitivity of AsPC-1 cells to MLN4924 in xenograft tumor model. 5 × 10⁶ AsPC-1 cells were inoculated subcutaneously in the right flank of nude mice. Tumor-bearing mice were grouped as follows: mice with normal control cells and treated with 50 ul of 300 nM MLN4924 every three days via intratumor injection for 5 times (NC + MLN4924 group), and mice with cells knocked down for NAPEPLD and treated at the same dosage (KD + MLN4924 group). (a) The tumor growth curve of two groups. The average size of NAPEPLD-knockdown tumors was lower compared with the control group (b) Tumors were resected at the end of the study. (c) The average weight of NAPEPLD-knockdown tumors was lower compared with the control group. (d) Representative IHC staining of cleaved caspase-3 in the resected tumors in the KD group (left) and NC group (right). *, P < 0.05; **, P < 0.01.
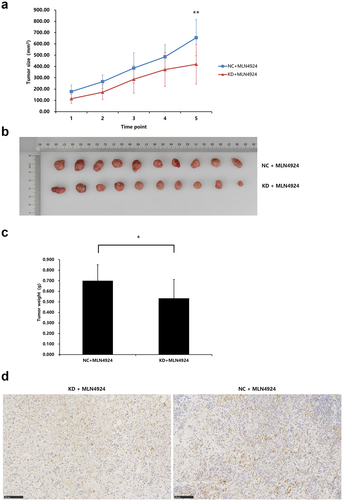
Table 3. Clinicopathological features of 90 pancreatic cancer patients
Table 4. Univariate and multivariate analyses of prognostic factors in patients with pancreatic cancer
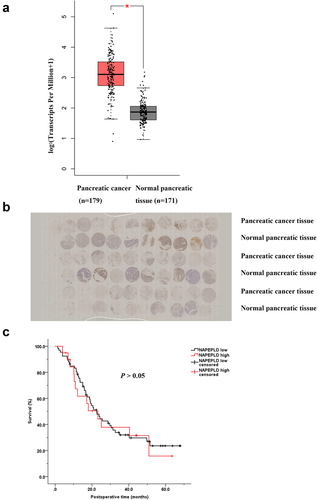
Figure 9. NAPEPLD was overexpressed in pancreatic cancer tissues. (a) NAPEPLD was overexpressed in pancreatic cancer compared to normal pancreatic tissues according to the RNA sequencing expression data from the TCGA and the GTEx projects using a standard processing pipeline. (b) Representative IHC staining of tissue microarray with paired pancreatic cancer and normal pancreatic tissues. (c) The survival curves of patients with pancreatic cancer of low NAPEPLD expression and of high NAPEPLD expression. *, P < 0.05.
Data availability statement
The authors confirm that the data supporting the findings of this study are available within the article and its supplementary materials.