
Figures & data
Figure 1. The circFAM53B level in glioma.
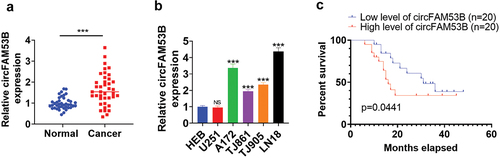
Figure 2. Up-regulation of circFAM53B intensified the malignant behaviors of glioma cells.
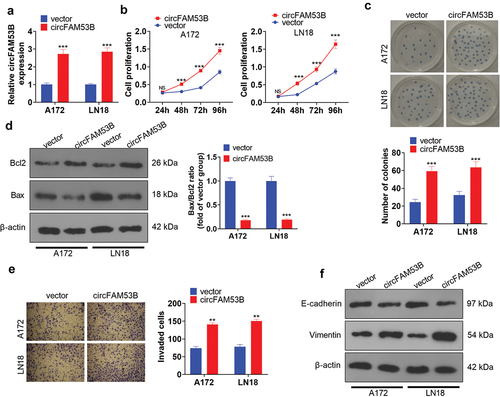
Figure 3. Influence of CircFAM53B knockdown on cell proliferation, invasion, EMT and apoptosis.
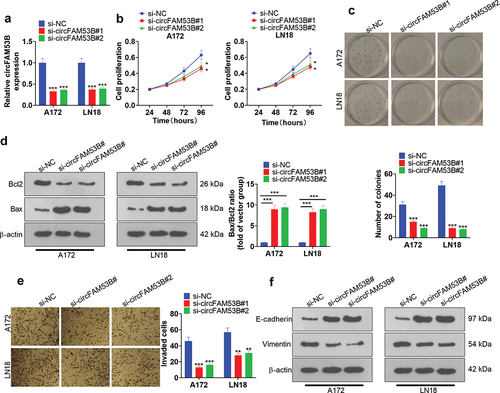
Figure 4. CircFAM53B boosted A172 cell proliferation and EMT in vivo.
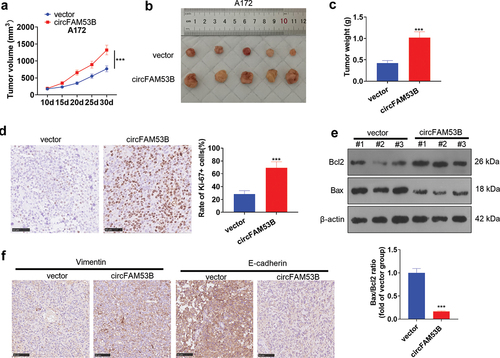
Figure 5. miR-28-5p was a sponge RNA of circFAM53B.
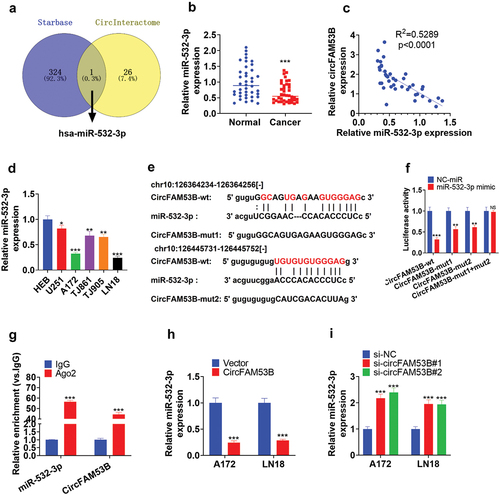
Figure 6. Impacts of circFAM53B/miR-532-3p on glioma cell proliferation, apoptosis and metastasis.
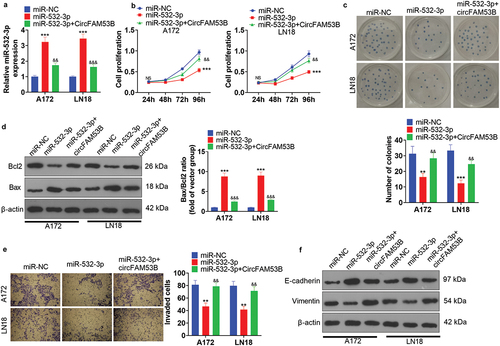
Figure 7. CircFAM53B/miR-532-3p modulated the MAPK/ERK pathway.
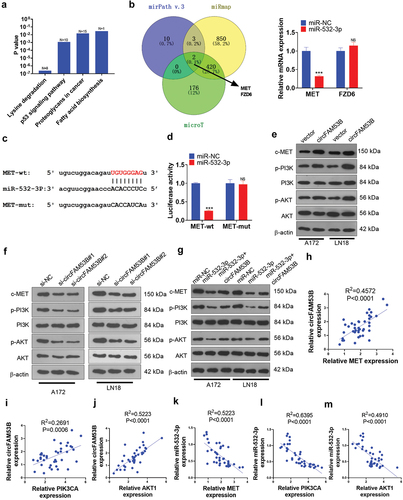
Figure 8. Impacts of inactivating the c-MET/PI3K/AKT pathway expression on the oncogenic effect of circFAM53B.
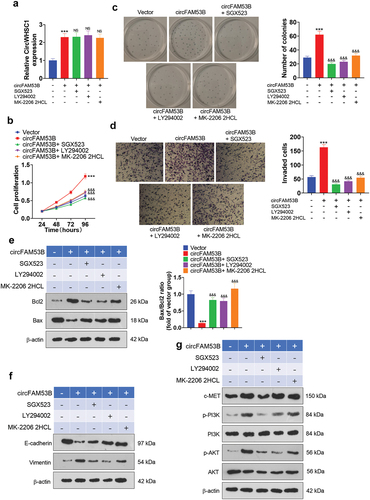
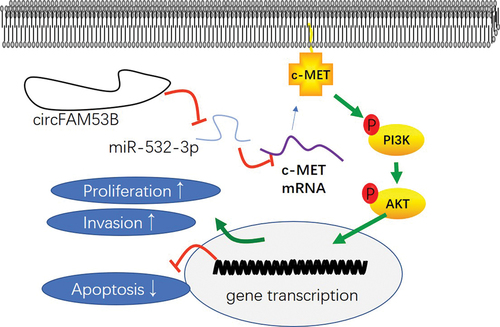
Figure 9. The mechanism diagram of circFAM53B in glioma.
Data availability statement
The data sets used and analyzed during the current study are available from the corresponding author on reasonable request.