Figures & data
Table 1. Primers for RT-qPCR
Figure 1. NH treatment reduced the histopathological changes of the SONFH mice and improved the structure of the femoral head. (a) HE staining was used to observe the effects of different concentrations of NH (10, 15, and 22.5 g/kg/d) on the pathological changes of femurs. Magnification, 100×; Scale bar = 30 µm. (b) Changes in femoral head tissue and trabecular bone were detected using μ-CT. The bone volume fraction (BV/TV) was calculated after SONFH mice treated with NH. (c) The trabecular bone morphology factor (Tb.Pf) was calculated after SONFH mice treated with NH. (d) The trabecular thickness (Tb.Th) was calculated after SONFH mice treated with NH. (e) The trabecular bone number (Tb.N) was calculated after SONFH mice treated with NH. (f) The trabecular spacing (Tb.Sp) was calculated after SONFH mice treated with NH. (g) The bone mineral density (BMD) was calculated after SONFH mice treated with NH. SONFH: steroid-induced femoral head necrosis; NH: Neohesperidin; ***P < 0.001 vs. control; #P< 0.05, ##P< 0.01, ###P< 0.001 vs. model).
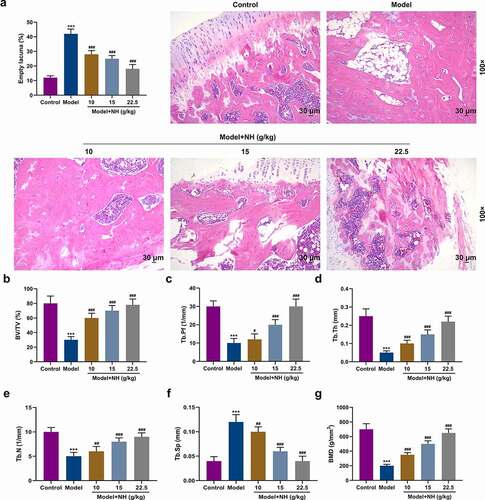
Figure 2. NH promoted proliferation and osteogenic differentiation of BMSCs. (a) Flow cytometry was used to identify standard markers (CD29, CD90 and CD34) for BMSCs. (b) The effects of NH on BMSCs viability were detected by CCK-8 on day 1, 2, 3, 7, and 14 after the treatment with different concentrations of NH. (c) ALP assay kit was used to detect the ALP activity of each group on day (s) 1, 2, 3, 7 and 14 after treatment with different concentrations of NH. (d) Alizarin Red S staining was used for mineralized matrix deposition. (e-h) RT-qPCR was used for the detection of osteoblast markers (Runx2, Osteocalcin, β-catenin, BMP2) after BMSCs treated with different concentrations of NH. (BMSCs: bone mesenchymal stem; RT-qPCR: real-time quantitative polymerase chain reaction; NH: Neohesperidin; CCK-8: Cell Counting Kit-8; *P < 0.05, **P < 0.01, ***P < 0.001 vs. control).
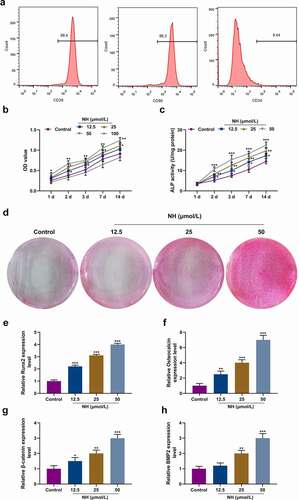
Figure 3. NH upregulated osteogenic gene expressions in BMSCs. (a-f) RT-qPCR was performed to detect the effects of NH on the expressions of osteogenic genes [Runx2, BMP2, Osteopontin (OPN), DLX5, Collagen I and Osteocalcin (OCN)] in Control group, NH group, NH+Noggin group, NH+DKK1 group and NH+Noggin+DKK1 group on days 3, 7 and 14. Each experiment was repeated three times, and β-actin served as an internal control (BMSCs: bone mesenchymal stem cells; RT-qPCR: real-time quantitative polymerase chain reaction; NH: Neohesperidin; *P < 0.05, **P< 0.01, ***P< 0.001, vs. control, ##P < 0.01, ###P < 0.001 vs. NH, ^^^P< 0.001 vs. NH+Noggin+DKK1).
![Figure 3. NH upregulated osteogenic gene expressions in BMSCs. (a-f) RT-qPCR was performed to detect the effects of NH on the expressions of osteogenic genes [Runx2, BMP2, Osteopontin (OPN), DLX5, Collagen I and Osteocalcin (OCN)] in Control group, NH group, NH+Noggin group, NH+DKK1 group and NH+Noggin+DKK1 group on days 3, 7 and 14. Each experiment was repeated three times, and β-actin served as an internal control (BMSCs: bone mesenchymal stem cells; RT-qPCR: real-time quantitative polymerase chain reaction; NH: Neohesperidin; *P < 0.05, **P< 0.01, ***P< 0.001, vs. control, ##P < 0.01, ###P < 0.001 vs. NH, ^^^P< 0.001 vs. NH+Noggin+DKK1).](/cms/asset/65796993-2eea-4c9a-bd4f-3624443adfe5/kccy_a_2015668_f0003_oc.jpg)
Figure 4. Effects of NH treatment on the expressions of Wnt/β-catenin signaling pathway-related and osteogenic genes. (a-i) RT-qPCR and Western blot was used for the detection of the expressions of Wnt/β-catenin signaling pathway-related proteins (TCF7, Lef1, c-myc) in Control group, NH group, NH+Noggin group, NH+DKK1 group, and NH+Noggin+DKK1 group on day 3, 7 and 14. Each experiment was repeated three times, and β-actin served as an internal control (BMSCs: bone mesenchymal stem cells; RT-qPCR: real-time quantitative polymerase chain reaction; NH: Neohesperidin; *P < 0.05 ***P < 0.001, vs. control, ##P < 0.01, ###P < 0.001 vs. NH, ^^P< 0.01, ^^^P< 0.001 vs. NH+Noggin+DKK1).
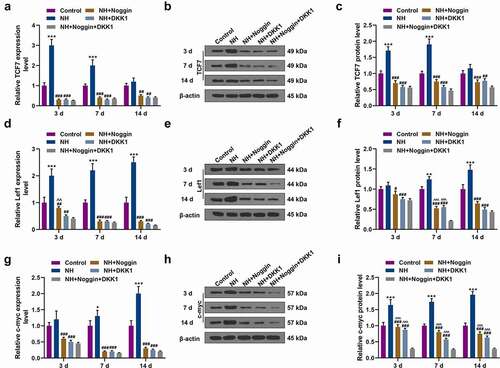
Figure 5. Effects of NH treatment on the expressions of c-jun, cyclin D, Runx2, BMP2 and TCF7. (a-f) RT-qPCR and Western blot was used for the detection of the expressions of c-jun and cyclin D in Control group, NH group, NH+Noggin group, NH+DKK1 group, and NH+Noggin+DKK1 group on day 3, 7 and 14. (g-j) Western blot was used for the detection of the expressions of Runx2, BMP2 and TCF7 in Control group, NH group, NH+Noggin group, NH+DKK1 group, and NH+Noggin+DKK1 group. Each experiment was repeated three times, and β-actin served as an internal control (BMSCs: bone mesenchymal stem cells; RT-qPCR: real-time quantitative polymerase chain reaction; NH: Neohesperidin; *P < 0.05 ***P < 0.001, vs. control, ##P < 0.01, ###P < 0.001 vs. NH, ^^P< 0.01, ^^^P< 0.001 vs. NH+Noggin+DKK1).
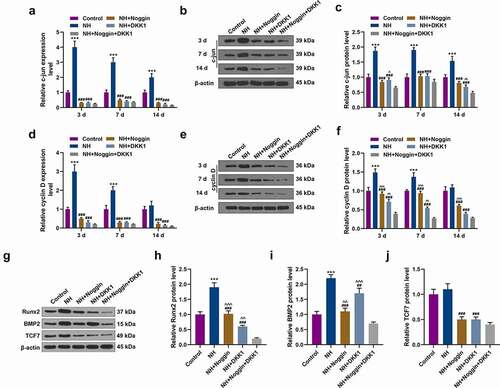
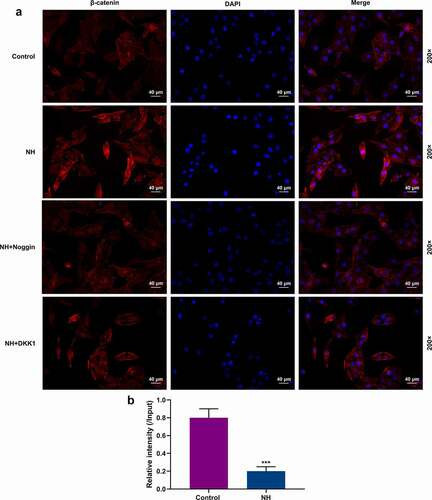
Figure 6. NH regulated the nuclear translocation of β-catenin and the H3K27me3 abundance on BMP2. (a) The BMSCs were treated with OIM in Control group, NH group, NH+Noggin group, and NH+DKK1 group. After incubation for 14 days, immunofluorescence staining of β-catenin (red) and DAPI (nuclear staining, blue) was used to stain the BMSCs (Scale bar = 40 µM; magnification, 200×; BMSCs: bone mesenchymal stem cells; NH: Neohesperidin). (b) ChIP-qPCR was performed to assess the H3K27me3 abundance on TSS of BMP2 gene. This assay was repeated independently for three times. ***P < 0.001 vs. control.