Figures & data
Figure 1. MSC-Exo-mediated KLF3-AS1 represses apoptosis of IL-1β-treated chondrocytes. MSCs were transfected with si-KLF3-AS1 or Scramble. Exosomes were extracted from the modified MSCs. (a) The expression of KLF3-AS1 in the exosomes was assessed by qRT-PCR. MSCsi-KLF3-AS1-Exo vs. MSCScramble-Exo: P = 0.0001. Chondrocytes were treated with IL-1β, or followed by treatment of PBS, MSC-Exo, MSCScramble-Exo or MSCsi-KLF3-AS1-Exo. Normal chondrocytes served as control. (b) The expression of KLF3-AS1 in the chondrocytes was examined by qRT-PCR. MSC-Exo vs. PBS: P < 0.0001; MSCsi-KLF3-AS1-Exo vs. MSCScramble-Exo: P < 0.0001. (c) Cell viability of chondrocytes was detected by performing CCK-8 assay. IL-1β vs. Control: P < 0.0001; MSC-Exo vs. PBS: P = 0.0008; MSCsi-KLF3-AS1-Exo vs. MSCScramble-Exo: P = 0.0043. (d) Apoptosis of chondrocytes was examined by performing flow cytometry. IL-1β vs. Control: P < 0.0001; MSC-Exo vs. PBS: P < 0.0001; MSCsi-KLF3-AS1-Exo vs. MSCScramble-Exo: P = 0.0004.
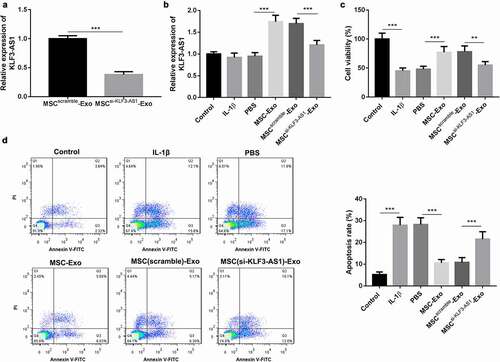
Figure 2. MSC-Exo-mediated KLF3-AS1 represses apoptosis of IL-1β-treated chondrocytes by repressing autophagy. MSCs were transfected with si-KLF3-AS1 or Scramble, and exosomes were extracted from the modified MSCs. Chondrocytes were treated with IL-1β combined with PBS, MSC-Exo, MSCScramble-Exo or MSCsi-KLF3-AS1-Exo. Normal chondrocytes served as control. (a) WB analysis of LC3-I, LC3-II and p62 expressions in the chondrocytes. (b) The ratio of LC3-II/LC3-I in the chondrocytes. IL-1β vs. Control: P < 0.0001; MSC-Exo vs. PBS: P = 0.0016; MSCsi-KLF3-AS1-Exo vs. MSCScramble-Exo: P = 0.0068. (c) The expression of p62 in the chondrocytes. IL-1β vs. Control: P < 0.0001; MSC-Exo vs. PBS: P < 0.0001; MSCsi-KLF3-AS1-Exo vs. MSCScramble-Exo: P < 0.0001. (d) GFP-LC3 fluorescence was used to observe the autophagy of chondrocytes. IL-1β vs. Control: P < 0.0001; MSC-Exo vs. PBS: P < 0.0001; MSCsi-KLF3-AS1-Exo vs. MSCScramble-Exo: P = 0.0004. Chondrocytes were treated with IL-1β combined with PBS or MSC-Exo, and then treated with rapamycin or DMSO. (e) Cell viability of chondrocytes was detected by performing CCK-8 assay. Rapamycin + PBS vs. DMSO + PBS: P = 0.0012; Rapamycin + MSC-Exo vs. DMSO + MSC-Exo: P = 0.0005; DMSO + MSC-Exo vs. DMSO + PBS: P = 0.0144; Rapamycin + MSC-Exo vs. Rapamycin + PBS: P = 0.0391. (f) Apoptosis of chondrocytes was examined by performing flow cytometry. Rapamycin + PBS vs. DMSO + PBS: P = 0.0018; Rapamycin + MSC-Exo vs. DMSO + MSC-Exo: P = 0.0013; DMSO + MSC-Exo vs. DMSO + PBS: P < 0.0001; Rapamycin + MSC-Exo vs. Rapamycin + PBS: P < 0.0001.
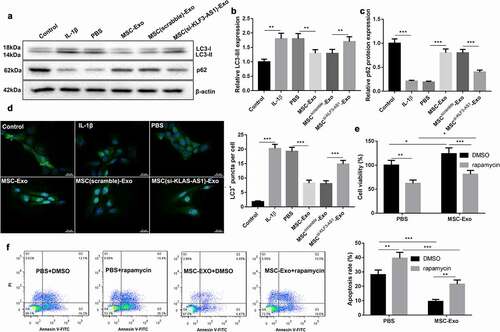
Figure 3. KLF3-AS1 inhibits apoptosis of IL-1β-treated chondrocytes by repressing autophagy. Chondrocytes were transfected with pcDNA3.1-KLF3-AS1 or pcDNA3.1-NC, followed by treatment of IL-1β. Normal chondrocytes served as control. (a) The expression of KLF3-AS1 in chondrocytes was detected by qRT-PCR. (b) WB analysis of LC3-I, LC3-II and p62 expressions in the chondrocytes. (c) The ratio of LC3-II/LC3-I in the chondrocytes. IL-1β vs. Control: P < 0.0001; KLF3-AS1 vs. vector: P = 0.0006. (d) The expression of p62 in the chondrocytes. IL-1β vs. Control: P < 0.0001; KLF3-AS1 vs. vector: P = 0.0004. Chondrocytes were transfected with pcDNA3.1-KLF3-AS1 or pcDNA3.1-NC, and then incubated with rapamycin or DMSO. (e) Cell viability of chondrocytes was detected by performing CCK-8 assay. Rapamycin + vector vs. DMSO + vector: P = 0.0031; Rapamycin + KLF3-AS1 vs. DMSO + KLF3-AS1: P = 0.0003; DMSO + KLF3-AS1 vs. DMSO + vector: P = 0.0006; Rapamycin + KLF3-AS1 vs. Rapamycin + vector: P = 0.0671. (f-g) GFP-LC3 fluorescence was used to observe the autophagy of chondrocytes. IL-1β vs. Control: P < 0.0001; KLF3-AS1 vs. vector: P < 0.0001. (h-i) Apoptosis of chondrocytes was detected by performing flow cytometry. Rapamycin + vector vs. DMSO + vector: P = 0.0012; Rapamycin + KLF3-AS1 vs. DMSO + KLF3-AS1: P = 0.016; DMSO + KLF3-AS1 vs. DMSO + vector: P < 0.0001; Rapamycin + KLF3-AS1 vs. Rapamycin + vector: P < 0.0001.
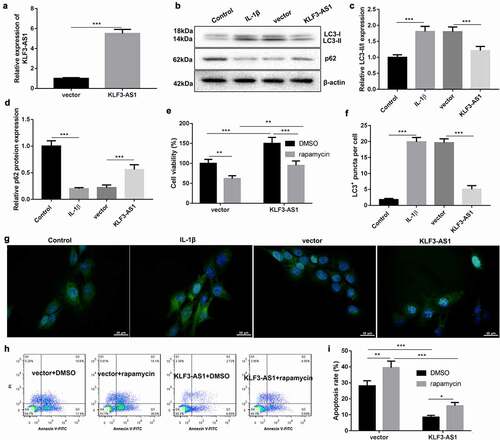
Figure 4. MSC-Exo-mediated KLF3-AS1 interacts with YBX1 to regulate PI3K/Akt/mTOR signaling pathway. MSCs were transfected with si-KLF3-AS1 or Scramble, and exosomes were extracted from the modified MSCs. Chondrocytes were treated with IL-1β combined with PBS, MSC-Exo, MSCScramble-Exo or MSCsi-KLF3-AS1-Exo. Normal chondrocytes served as control. (a) WB analysis of PI3K, Akt, p-AKT, mTOR and p-mTOR expressions in the chondrocytes. (b) The expression of PI3K in the chondrocytes. IL-1β vs. Control: P < 0.0001; MSC-Exo vs. PBS: P < 0.0001; MSCsi-KLF3-AS1-Exo vs. MSCScramble-Exo: P = 0.0006. (c) The expression of p-AKT in the chondrocytes. IL-1β vs. Control: P < 0.0001; MSC-Exo vs. PBS: P < 0.0001; MSCsi-KLF3-AS1-Exo vs. MSCScramble-Exo: P = 0.0035. (d) The expression of p-mTOR in the chondrocytes. IL-1β vs. Control: P < 0.0001; MSC-Exo vs. PBS: P < 0.0001; MSCsi-KLF3-AS1-Exo vs. MSCScramble-Exo: P = 0.0021. (e) The interaction between and KLF3-AS1 and YBX1 in chondrocytes was verified by RNA pull-down. (f-g) The interaction between and KLF3-AS1 and YBX1 in chondrocytes was determined by RIP assay. YBX1 vs. IgG: P = 0.0053.
Figure 5. MSC-Exo-mediated KLF3-AS1 represses autophagy and apoptosis of chondrocytes by activating PI3K/Akt/mTOR signaling pathway. Chondrocytes were transfected with si-YBX1 or Scramble, and then treated with IL-1β combined with PBS or MSC-Exo. Normal chondrocytes served as control. (a) WB analysis of PI3K, Akt, p-AKT, mTOR and p-mTOR expressions in the chondrocytes. (b) The expression of PI3K in the chondrocytes. MSC-Exo vs. PBS: P = 0.0001; MSC-Exo + scramble vs. MSC-Exo + si-YBX1: P = 0.0049. (c) The expression of p-AKT in the chondrocytes. MSC-Exo vs. PBS: P < 0.0001; MSC-Exo + scramble vs. MSC-Exo + si-YBX1: P = 0.0016. (d) The expression of p-mTOR in the chondrocytes. MSC-Exo vs. PBS: P < 0.0001; MSC-Exo + scramble vs. MSC-Exo + si-YBX1: P = 0.0155. (e) Cell viability of chondrocytes was detected by performing CCK-8 assay. MSC-Exo vs. PBS: P < 0.0042; MSC-Exo + scramble vs. MSC-Exo + si-YBX1: P = 0.0405. (f) WB analysis of LC3-I, LC3-II and p62 expressions in the chondrocytes. (g) The ratio of LC3-II/LC3-I in the chondrocytes. MSC-Exo vs. PBS: P = 0.0004; MSC-Exo + scramble vs. MSC-Exo + si-YBX1: P = 0.0051. (h) The expression of p62 in the chondrocytes. MSC-Exo vs. PBS: P < 0.0001; MSC-Exo + scramble vs. MSC-Exo + si-YBX1: P = 0.0003. (i-j) Apoptosis of chondrocytes was detected by performing flow cytometry. MSC-Exo vs. PBS: P < 0.0001; MSC-Exo + scramble vs. MSC-Exo + si-YBX1: P = 0.0008.
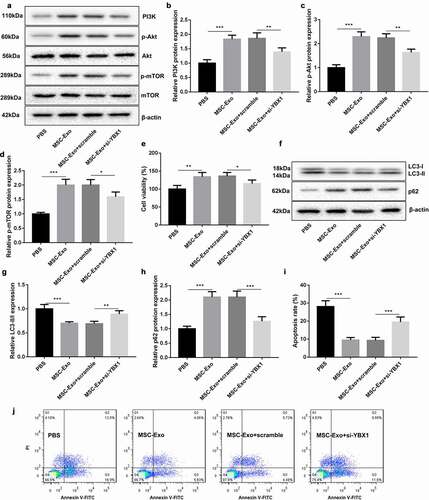
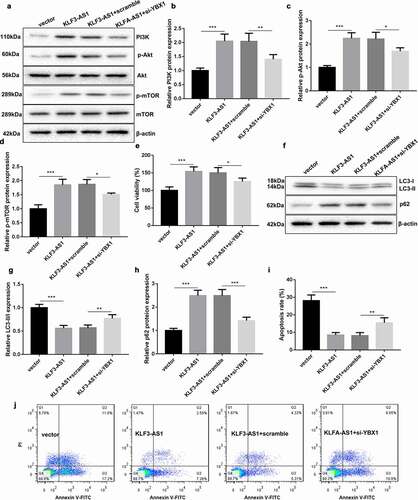
Figure 6. KLF3-AS1/YBX1 represses autophagy and apoptosis of chondrocytes through PI3K/Akt/mTOR signaling pathway. Chondrocytes were transfected with pcDNA3.1-KLF3-AS1 or pcDNA3.1-NC and si-YBX1 or Scramble, and then treated with IL-1β. (a) WB analysis of PI3K, Akt, p-AKT, mTOR and p-mTOR expressions in the chondrocytes. (b) The expression of PI3K in the chondrocytes. KLF3-AS1 vs. vector: P = 0.0003; KLF3-AS1 + scramble vs. KLF3-AS1 + si-YBX1: P = 0.0064. (c) The expression of p-AKT in the chondrocytes. KLF3-AS1 vs. vector: P < 0.0001; KLF3-AS1 + scramble vs. KLF3-AS1 + si-YBX1: P = 0.015. (d) The expression of p-mTOR in the chondrocytes. KLF3-AS1 vs. vector: P = 0.0001; KLF3-AS1 + scramble vs. KLF3-AS1 + si-YBX1: P = 0.0192. (e) Cell viability of chondrocytes was detected by performing CCK-8 assay. KLF3-AS1 vs. vector: P = 0.0006; KLF3-AS1 + scramble vs. KLF3-AS1 + si-YBX1: P = 0.0362. (f) WB analysis of LC3-I, LC3-II and p62 expressions in the chondrocytes. (g) The ratio of LC3-II/LC3-I in the chondrocytes. KLF3-AS1 vs. vector: P < 0.0001; KLF3-AS1 + scramble vs. KLF3-AS1 + si-YBX1: P = 0.007. (h) The expression of p62 in the chondrocytes. KLF3-AS1 vs. vector: P < 0.0001; KLF3-AS1 + scramble vs. KLF3-AS1 + si-YBX1: P = 0.0001. (i-j) Apoptosis of chondrocytes was detected by performing flow cytometry. KLF3-AS1 vs. vector: P < 0.0001; KLF3-AS1 + scramble vs. KLF3-AS1 + si-YBX1: P = 0.0058.