Figures & data
Figure 1. TP53TG1 is elevated in CC tissues and cells and reduced TP53TG1 represses cell growth and promotes apoptosis of CC cells. (a), TP53TG1 level in CC tissues and normal tissues (n = 45) was detected by RT-qPCR; (b), TP53TG1 level in CC cell lines and normal cervical epithelial cells (HcerEpic) was examined by RT-qPCR; (c), TP53TG1 expression in HeLa cells after the transfection with sh-TP53TG1 or oe-TP53TG1 was assessed by RT-qPCR; (d), cell proliferation after transfection with sh-TP53TG1 or oe-TP53TG1 was assessed by CCK-8 assay; (e), cell migration after transfection with sh-TP53TG1 or oe-TP53TG1 was detected by the scratch test; (f), cell invasion after transfection with sh-TP53TG1 or oe-TP53TG1 was determined by Transwell assay; (g), cell apoptosis after transfection with sh-TP53TG1 or oe-TP53TG1 was assessed by flow cytometry. (h), the change of tumor size and volume after transfection with sh-TP53TG1 or oe-TP53TG1 in nude mice. The data in the figure were all measurement data, and the values were represented by mean ± standard deviation, the t-test was used for the comparison between two groups, ANOVA was adopted for the comparison among multiple groups and Tukey’s post hoc test was used for pairwise comparisons after ANOVA; * P < 0.05 vs. HcerEpic cells; # P < 0.05 vs. the TP53TG1-NC group; n = 6; the cell experiment was repeated at least three times independently.
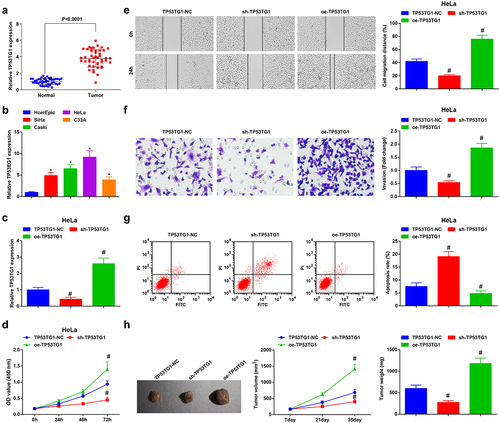
Figure 2. TP53TG1 targets miR-33a-5p. (a), the binding site for TP53TG1 and miR-33a-5p was predicted by the bioinformatic website; (b), the targeting relationship between miR-33a-5p and TP53TG1 was validated by luciferase reporter gene assay; (c), the effects of TP53TG1 on miR-33a-5p enrichment were detected by RNA pull-down assay; (d), the correlation between TP53TG1 and miR-33a-5p in CC tissues was assessed by linear regression analysis; The data in the figure were all measurement data, and the values were represented by mean ± standard deviation, the t-test was used for the comparison between two groups; P < 0.05 was regarded as the indicator of statistical significance. The cell experiment was repeated at least three times independently.
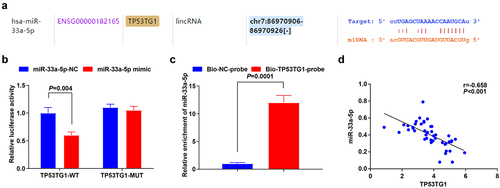
Figure 3. MiR-33a-5p is depleted in CC tissues, and miR-33a-5p elevation hinders HeLa cell growth and tumorigenesis whereas reduced miR-33a-5p has the opposite impacts on CC cells. (a), miR-33a-5p expression in CC tissues and normal tissues (n = 45) was detected by RT-qPCR; (b), miR-33a-5p expression after transfection with miR-33a-5p mimic or miR-33a-5p inhibitor was examined by RT-qPCR; (c), cell proliferation after transfection with miR-33a-5p mimic or miR-33a-5p inhibitor was assessed by CCK-8 assay; (d), cell migration after transfection with miR-33a-5p mimic or miR-33a-5p inhibitor was detected by scratch test; (e), cell invasion after transfection with miR-33a-5p mimic or miR-33a-5p inhibitor was determined by Transwell assay; (f), cell apoptosis after transfection with miR-33a-5p mimic or miR-33a-5p inhibitor was assessed by flow cytometry. The data in the figure were all measurement data, and the values were represented by mean ± standard deviation, the t-test was used for the comparison between two groups, ANOVA was adopted for the comparison among multiple groups and Tukey’s post hoc test was used for pairwise comparisons after ANOVA; * P < 0.05 vs. the miR-33a-5p NC group. the cell experiment was repeated at least three times independently.
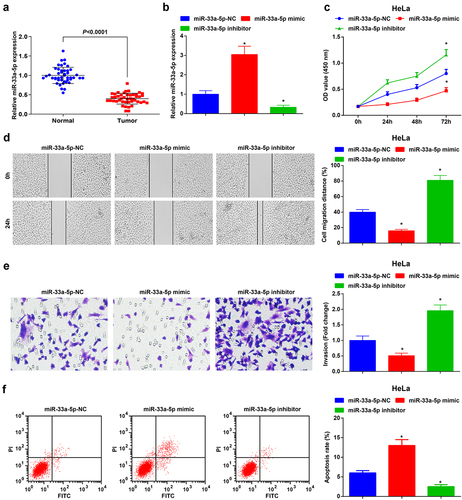
Figure 4. FOXK2 is targeted by miR-33a-5p. (a), the binding site of miR-33a-5p and FOXK2 was predicted by bioinformatic website; (b), the targeting relationship between miR-33a-5p and FOXK2 was verified by luciferase reporter gene assay; (c/d), the effects of the up- or down-regulation of miR-33a-5p on FOXK2 expression were examined by RT-qPCR and Western blot assay; (e), the correlation between FOXK2 and miR-33a-5p in CC tissues was assessed by linear regression analysis. The data in the figure were all measurement data, and the values were represented by mean ± standard deviation, the t-test was used for the comparison between two groups; ANOVA was adopted for the comparison among multiple groups and Tukey’s post hoc test was used for pairwise comparisons after ANOVA; * P< 0.05 vs. the miR-33a-5p NC group
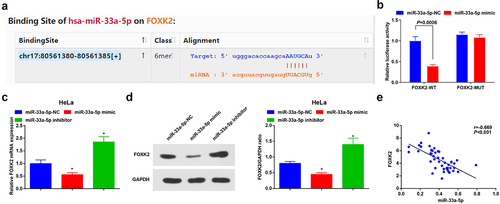
Figure 5. Inhibition of FOXK2 represses the development of CC cells. (a), FOXK2 expression in CC tissues and normal tissues (n = 45) was detected by RT-qPCR; (b/c), FOXK2 level after transfection with sh-FOXK2 or oe-FOXK2 was examined by RT-qPCR and Western blot assay; (d), cell proliferation after transfection with sh-FOXK2 or oe-FOXK2 was assessed by CCK-8 assay; (e), cell migration after transfection with sh-FOXK2 or oe-FOXK2 was detected by scratch test; (f), cell invasion after transfection with sh-FOXK2 or oe-FOXK2 was determined by Transwell assay; (g), cell apoptosis after transfection with sh-FOXK2 or oe-FOXK2 was assessed by flow cytometry. The data in the figure were all measurement data, and the values were represented by mean ± standard deviation, the t-test was used for the comparison between two groups; ANOVA was adopted for the comparison among multiple groups and Tukey’s post hoc test was used for pairwise comparisons after ANOVA; * P < 0.05 vs. the FOXK2-NC group. the cell experiment was repeated at least three times independently.
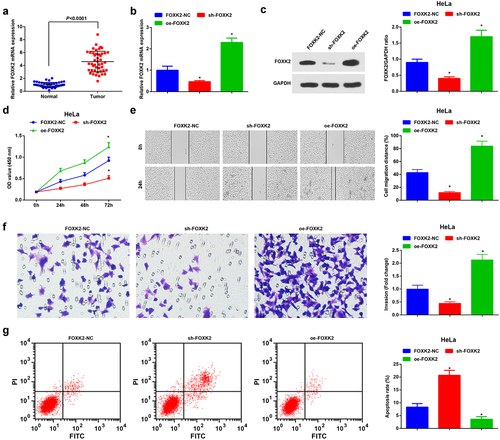
Figure 6. Reduced TP53TG1 inhibits the development of CC via up-regulating miR-33a-5p to suppress FOXK2. (a/b), miR-33a-5p and FOXK2 level in HeLa cells after transfection with sh-TP53TG1 or oe-TP53TG1 was detected by RT-qPCR and Western blot assay; (c), cell proliferation after transfection with sh-TP53TG1 + miR-33a-5p inhibitor or sh-TP53TG1 + oe-FOXK2 was assessed by CCK-8 assay; (d), cell migration after transfection with sh-TP53TG1 + miR-33a-5p inhibitor or sh-TP53TG1 + oe-FOXK2 was detected by scratch test; (e), cell invasion after transfection with sh-TP53TG1 + miR-33a-5p inhibitor or sh-TP53TG1 + oe-FOXK2 was determined by Transwell assay; (f), cell apoptosis after transfection with sh-TP53TG1 + miR-33a-5p inhibitor or sh-TP53TG1 + oe-FOXK2 was assessed by flow cytometry. The data in the figure were all measurement data, and the values were represented by mean ± standard deviation; ANOVA was adopted for the comparison among multiple groups and Tukey’s post hoc test was used for pairwise comparisons after ANOVA; in panel 6a and 6b, * P < 0.05 vs. the sh-TP53TG1-NC group; # P < 0.05 vs. the sh-TP53TG1 + FOXK2-NC group; $ P < 0.05 vs. the sh-TP53TG1 + miR-33a-5p-NC group.
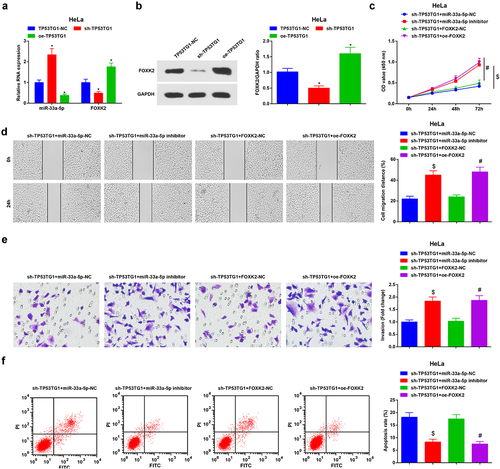
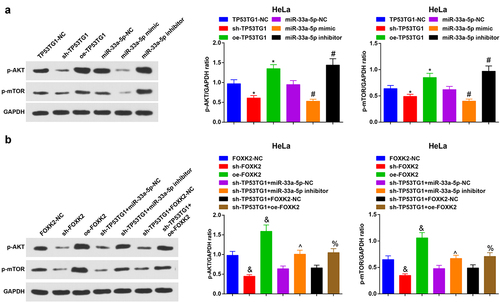
Figure 7. TP53TG1/miR-33a-5p/FOXK2 activates the PI3K/AKT/mTOR signaling pathway via promoting related protein activity. (a-b), the phosphorylation levels of PI3K, AKT and mTOR in HeLa cells were detected by Western blot assay. The data in the figure were all measurement data, and the values were represented by mean ± standard deviation, one-way ANOVA was adopted for the comparison among multiple groups and Tukey’s post hoc test was used for pairwise comparisons after one-way ANOVA; * P < 0.05 vs. the TP53TG1-NC group; # P < 0.05 vs. the miR-33a-5p-NC group; & P < 0.05 vs. the FOXK2-NC group; ^ P < 0.05 vs. the sh-TP53TG1 + miR-33a-5p-NC group; % P < 0.05 vs. the sh-TP53TG1 + FOXK2-NC group.