
Figures & data
Figure 1. HOTAIR inhibition affect the expression and distribution of YAP1 in HeLa cells. (a). Representative images showing the distribution of YAP1 in HeLa cells after HOTAIR knockdown under confocal microscopy. (b). The whole YAP1 expression was measured after HOTAIR inhibition by Western blotting. (c) (d). Western blotting analysis the expression of YAP1 in cytoplasm or nucleus after HOTAIR inhibition. (e). The effect of knockdown HOTAIR or/and YAP1 on cell migration was determined by wound healing assay. (f). Quantification of the wound healing assay. (g). The effect of knockdown HOTAIR or/and YAP1 on cell invasion was determined in a Boyden chamber assay. (h). And the number of cells on the underside of the filter was determined and significantly (P < 0.05) changed invasion is indicated. Data are presented as means ± S.D. and represent results from three independent experiments. Statistically significant differences are indicated: *, P < 0.05.
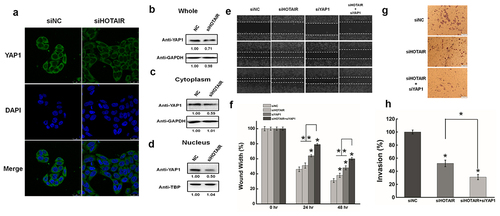
Figure 2. The function effects of YAP1 in HeLa cells. (a). HeLa cells were transfected with pYAP1 or pCDNA3.1. The YAP1 expression level was determined by Western blotting at 24 hr and 48 hr after transfection. GAPDH serves as the loading control. (b). The cell adhension was determined after transfecting YAP1 at 24 hr and 48 hr. (c). The effect of YAP1 on cell migration was determined by wound healing assay. (d). Quantification of the wound healing assay. (e). The effect of YAP1 on cell invasion was determined in a Boyden chamber assay. (f). The number of cells on the underside of the filter was determined and significantly (P < 0.05) changed invasion is indicated. (g). Western blots analysis of the YAP1 protein expression at 48 hr after transfected with siYAP11or siNC. (h). The cell adhension was determined after silencing YAP1 at 24 hr and 48 hr. (i). The effect of YAP1 inhibition cell migration was determined by wound healing assay. (j). Quantification of the wound healing assay. (k). The effect of YAP1 knockdown on cell invasion was determined in a Boyden chamber assay. (l). The number of cells on the underside of the filter was determined and significantly (P < 0.05) changed invasion is indicated. Data are presented as means ± S.D. and represent results from three independent experiments. Statistically significant differences are indicated: *, P < 0.05.
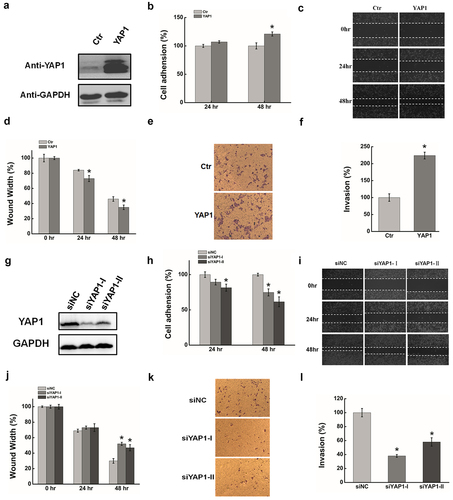
Figure 3. YAP1 is a potential target of miR-200a-3p. (a). HeLa cells were transfected with miR-200a-3p mimics or NC for 48 hrs. The abundance of miR-200a-3p expression was determined by qRT-PCR. (b). Western blots analysis of the YAP1 protein expression at 48 hr after transfecting with miR-200a-3p mimics or NC. (c). qRT-PCR was used to measure the efficiency of miR-200a-3p inhibition after transfection at 48 hr. (d). Western blots analysis of MKL1 expression at 48 hr after transfecting with miR-200a-3p inhibitor or NC. (e). Diagram of YAP1-3`UTR containing reporter constructs. (f). In luciferase assays using HeLa cells, transfection of miR-200a-3p and YAP1-3`UTR-mut increased the luciferase activities compared with transfection of miR-200a-3p and YAP1-3`UTR-WT. Data are presented as means ± S.D. and results are from one representative experiment of at least three. *, P < 0.05.
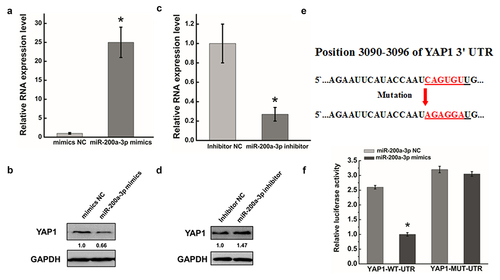
Figure 4. Effect of miR-200a-3p on cells migration and invasion in HeLa cells. (a) (e). The effect of miR-200a-3p on cell migration was determined by wound healing assay. (b) (f). Quantification of the wound healing assay.(c) (g). The effect of miR-200a-3p on cell invasion was determined in a Boyden chamber assay. (d) (h). The number of cells on the underside of the filter was determined and significantly (P < 0.05) changed invasion is indicated. Data are presented as means ± S.D. and represent results from three independent experiments. Statistically significant differences are indicated: *, P < 0.05.
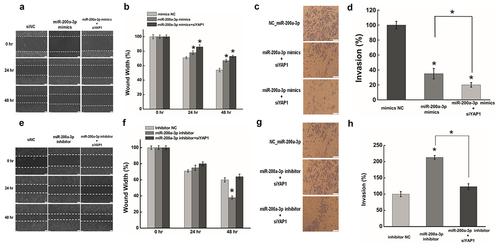
Figure 5. HOTAIR suppressed miR-200a-3p expression by H3 lysine 27 trimethylation.(a).The RNA expression of miR-206 after transfecting siHOTAIR at 48 hr by qRT-PCR. The expression level of miR-206 was normalized to U6. (b). Western blotting was used to measure the expression ofH3K27 trimethylation after inhibiting HOTAIR at 48 hr. GAPDH was used as an internal control. (c). After transfecting with siHOTAIR or siNC, cells were lysed and incubated with H3K27me3 monoclonal antibody at 4°C overnight. Chromatin immunoprecipitation (ChIP) assay was used to determinedtheH3K27me3 expression level occupied on the promoter of miR-200a-3p in HeLa cells. (d). Quantification of the ChIP assay. Data are presented as means ± S.D. and represent results from three independent experiments. Statistically significant differences are indicated: *, P < 0.05.
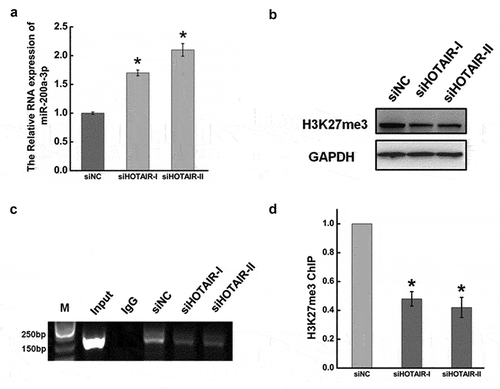
Figure 6. YAP1 promoted the transcription expression of RPL23 by binding the promoter region via TEAD. (a). Western blots analysis of the RPL23 protein expression at 48 hr after overexpressing YAP1 in HeLa cells. (b). qRT-PCR was used to measure the RPL23 RNA level after transfecting pYAP1at 48 hr. (c). The RPL23 protein expression level was measured after YAP1 inhibition at 48 hr by Western blotting. (d). qRT-PCR was used to measure the RPL23 RNA level after transfecting siYAP1at 48 hr. (e). Dual luciferase assay was used to determine the transcriptional regulation between YAP1 and RPL23. (f). ChIP assay was used to determine the interaction between YAP1 and RPL23 in HeLa cells. Input = 5% of total lysate. IgG = immunoglobulin G. (g) (h). Representative images showing the distribution of RPL23 in HeLa cells after YAP1 knockdown/overexpression under confocal microscopy. Data are presented as means ± S.D. and represent results from three independent experiments. Statistically significant differences are indicated: *, P < 0.05.
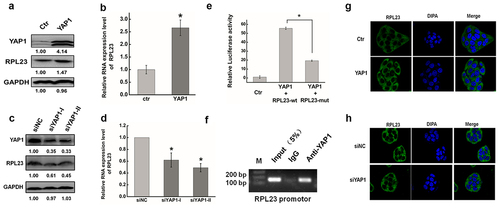
Figure 7. Effect of RPL23 on cells migration and invasion in HeLa cells. (a). The effect of expression RPL23 on cell migration was determined by wound healing assay. (b). Quantification of the wound healing assay. (c). The effect of RPL23 inhibition on cell migration was determined by wound healing assay. (d). Quantification of the wound healing assay. (e). The effect of RPL23 on cell invasion was determined in a Boyden chamber assay. (f). The number of cells on the underside of the filter was determined. (g). The effect of RPL23inhibition on cell invasion was determined in a Boyden chamber assay. (h). The number of cells on the underside of the filter was determined. Data are presented as means ± S.D. and represent results from three independent experiments. Statistically significant differences are indicated: *, P < 0.05.
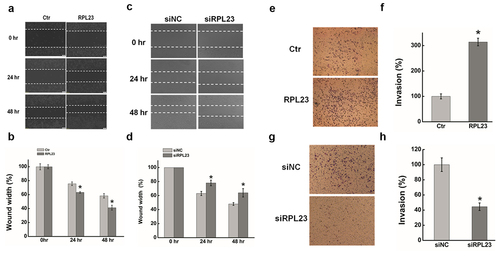
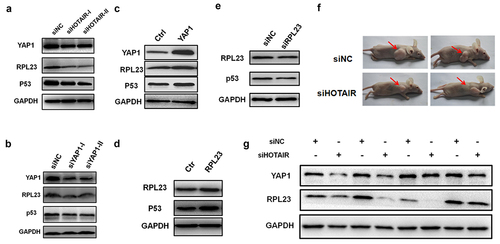
Figure 8. HOTAIR regulated YAP1 and RPL23 expression in nude mice. (a). Western blotting was used to measured YAP1, RPL23 and p53 protein level after HOTAIR inhibition at 48 hr in HeLa cells. (b)(c). RPL23 and p53 were measured at 48 hr after transfecting siYAP1or pYAP1 in HeLa cells. (d)(e). After Inhibition/overexpressing RPL23 in HeLa cells, p53 protein level was measured by Western blotting at 48 hr. (f). Representative photographs of xenografts were taken 3 weeks after injection of HeLa cells transfected with siHOTAIR or siNC. (g). Western blotting of YAP1 and RPL23 protein expression in tumors excised from the xenografts mice model.
Supplemental Material
Download Zip (24.4 KB)Data availability statement for basic data sharing policy
The data that support the findings of this study are available from the corresponding author upon reasonable request(peng zheng [email protected]).