
Figures & data
Figure 1. The expression of UBE2T in OC and its relation to clinical features of patients with OC. Oncomine data (a) and GEPIA data (b) indicated UBE2T mRNA upregulated in OC. C The Oncomine data showed no difference of UBE2T mRNA expression among mucinous, serious and endometrioid OC tissues. D GEPIA data showed UBE2T mRNA significantly correlated to stage of OC. E UALCAN data showed UBE2T protein was upregulated in OC tissues. F IHC results of UBE2T protein level in normal tissues and OC tissues with different pathological types and stages. *P < 0.05, ** P < 0.01, ***P < 0.001, ns, no significant statistical difference.
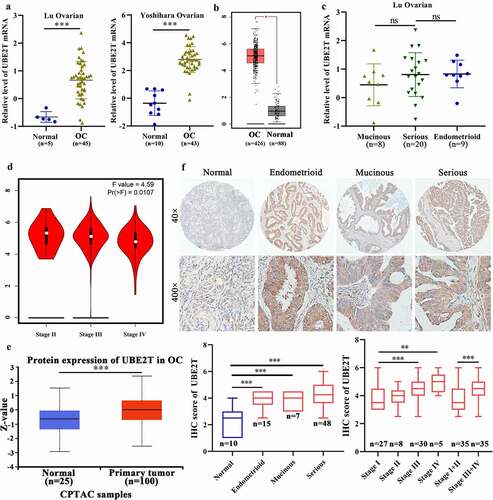
Table 1. Correlation between UBE2T expression and clinicopathological characteristics in ovarian cancer (n = 70, Chi-square or Fisher exact test)
Table 2. Univariate analysis and multivariate analysis of prognostic factors for overall survival using Cox proportional hazards regression model (N = 70)
Figure 2. UBE2T upregulation predicts poor prognosis of patients with OC. A UBE2T mRNA level was inversely associated with OS (left panel), PFS (middle panel),and PPS (right panel) of OC patients indicated by Kaplan-Meier Plotter data. B UBE2T mRNA level was inversely associated with OS of OC patients indicated by GEPIA data. C UBE2T protein level was negatively related to OS of OC patients demonstrated by our data.
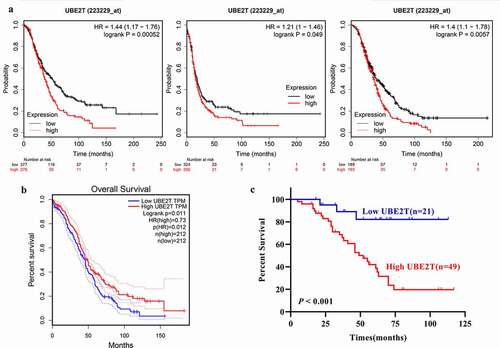
Figure 3. UBE2T depletion inhibits growth, proliferation and invasion of OC cells. A Western blot indicating the UBE2T expression among IOSE80, OVCAR3, HO8910, SKOV3, SKOV3-ip1 and HO8910-PM cells. B Western blot indicating the knockdown efficacy of siUBE2T-1 and −2 (50 nM) in OC cells. Analyzing the effects of UBE2T knockdown on growth, proliferation, migration, and invasion via CCK-8 (c), plate clone formation (d), transwell migration (e) and transwell invasion (f). *P < 0.05, ** P < 0.01, ***P < 0.001.
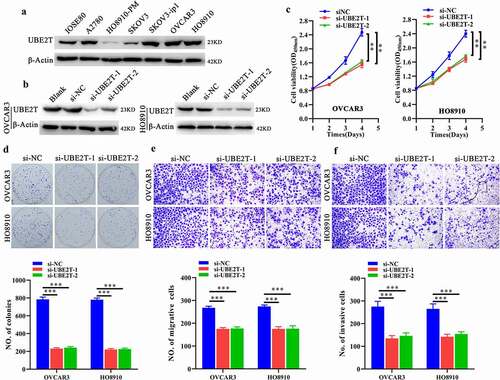
Figure 4. UBE2T depletion inhibited EMT process by inducing autophagy via suppressing AKT/mTOR in OC cells. A Western blot indicating the level of N-cad, E-cad, Slug, and MMP2 in OC cells with UBE2T silencing. B Western blot indicating the level of p-AKT (S473), AKT, p-mTOR (S2448) and mTOR in OC cells with UBE2T depletion. C Western blot showing the level of BECN1, p62, and LC3A/B-I/II in OC cells with UBE2T knockdown. D Western blot indicating the accumulated LC3A/B-II of OC cells with UBE2T knockdown under CQ (50 μM) treatment. E Western blot indicating the influences of MK2206 (2.5 μM) on the rescue effects of UBE2T on AKT and autophagy activity, reflected by the level of p-AKT(S473), AKT, and LC3A/B, in OC cells with UBE2T knockdown. F Western blot indicating the influences of BECN1 knockdown on BECN1 and LC3A/B-I/II, and the level of EMT related proteins, N-cad, E-cad, and Slug, with UBE2T knockdown.
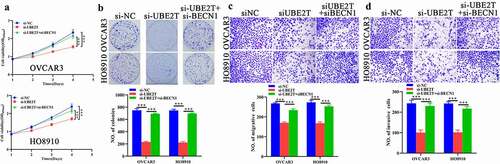
Figure 5. Autophagy suppression antagonizes the inhibitory effects of UBE2Tdepletion on malignant characteristics of OC cells. CCK-8 (a), plate clone formation (b), transwell migration (c), and transwell invasion (d) assays indicating the influences of BECN1 depletion on effects of UBE2T knockdown on growth, proliferation and invasion of OC cells. ***P < 0.001.
Data availability statement
The online data used to support the findings of this study are from Oncomine (http://www.oncomine.org), GEPIA (http://gepia.cancer-pku.cn/), UALCAN (http://ualcan.path.uab.edu/), and Kaplan–Meier (K-M) plotter (http://kmplot.com/analysis/). The experimental data that support the findings of this study are available from the corresponding author, [XX], upon reasonable request.